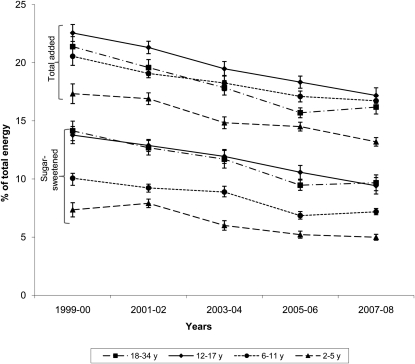
FIGURE 1.
Mean (±SE) trends in the proportion of total energy intake consumed as added sugars and as sugar-sweetened beverages (SSBs) in US children and young adults by age group, NHANES 1999–2000 to 2007–2008. Results of linear trends by using Wald's F tests were P < 0.0001 for total added-sugar and SSB intakes for all subjects aged <35 y. In subjects aged 35–54 y, P-trend = 0.0005 for total added-sugar intake and P-trend = 0.001 for SSB intake; in subjects aged ≥55 y, P-trend = 0.002 for total added-sugar intake and P-trend = 0.01 for SSB intake.

