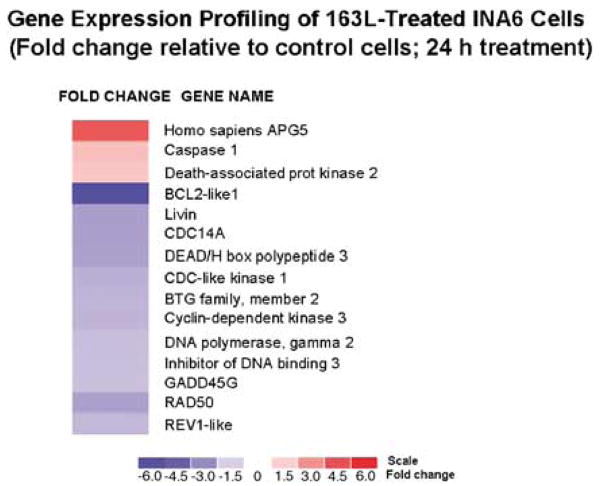
Figure 5.
Gene expression profile following GRN163L treatment of MM cells. INA6 myeloma cells were treated with 1 μM control oligonucleotide or GRN163L for 24 h and gene expression was evaluated using Human Genome U133 GeneChip arrays (Affymetrix). Fold change in gene expression in GRN163L-treated cells relative to control cells is shown by intensities of red (indicating upregulation) and blue (indicating downregulation) colors. The scale is shown at the bottom.

