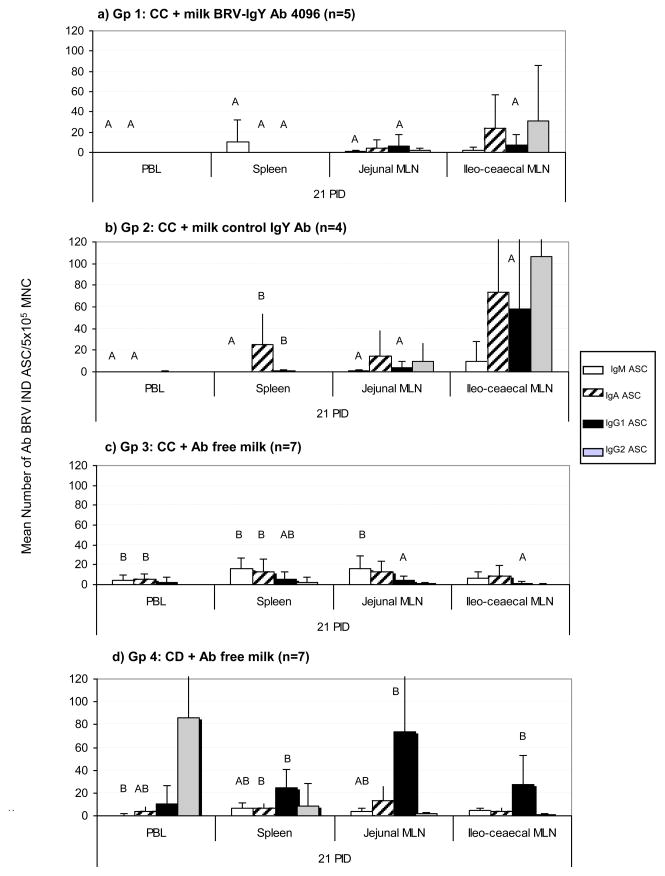
Figure 3.
Mean numbers of BRV ASC per 5 × 10⁵/MNC obtained from systemic lymphoid tissues (PBL and Spleen) and MLN draining the small and large intestine, at 21 PID. a) Gp 1: calves fed with control colostrum (CC) followed by BRV egg yolk supplemented milk with a final BRV IgY Ab titer of 4096; b) Gp 2: calves receiving CC followed by CONTROL egg yolk supplemented milk with a final BRV IgY Ab titer <4; c) Gp 3: calves receiving CC and d) Gp 4: colostrum deprived calves, both fed Ab-free milk. For each tissue, when comparing mean ASC numbers of the same isotype, among treatment groups: bars with different letter indicate a significant difference, (Kruskal-Wallis rank sum test, p<0.05). n= number of calves in each group. Error bars indicate SD.

