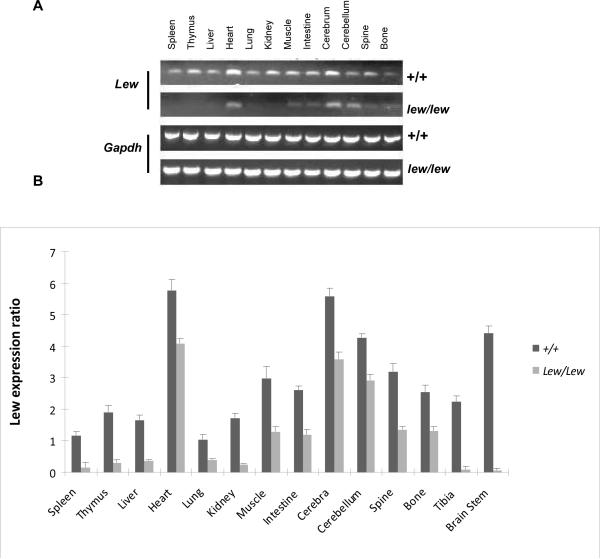
Fig. 3.
Expression pattern of Lew in different tissues from normal +/+ and disease lew/lew mice by semi-quantitative RT-PCR. A pair of primers (forward:GGGCAGTTTCTGAGCAATGT, reverse: TCCAACAGGGAAAACCTCTG) was designed to cover from exon 3 to exon 6 of Lew gene with a size of 394 bps. Three individual 14 days old +/+ and three same age matched three lew/lew mice RNA samples from 12 different tissues were used for this experiment and a duplicate well was run for each sample. The figure only shows one sample from each type on the gel image. After electrophoresis (3A) and scanning, all PCR product bands were analyzed by using the software Scion Image and relative mRNA expression was estimated by normalization with Gapdh. The final ratios were calculated by dividing the relative values of different tissues by the lowest value for lung of normal mice (3B).

