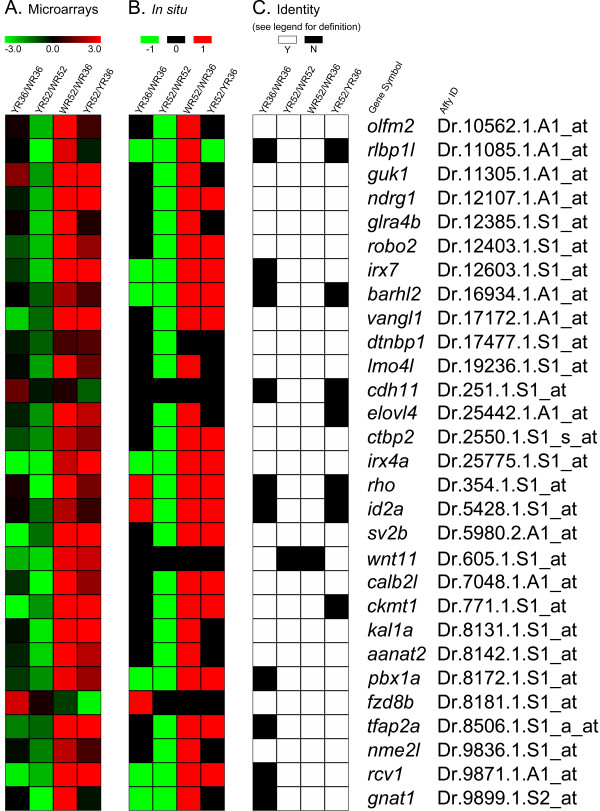
Figure 1.
A comparison of the microarray results with the corresponding in situ hybridization experiments. (A) A heatmap of the fold changes of all retinal comparisons obtained by the original microarray analysis [12](Additional file 2, Table S1). The corresponding gene symbols and AffyIDs are shown on the right. All fold changes are plotted on the log2 scale. Red colour indicates an over-expression in that comparison, green indicates an under-expression and black indicates no change. YR36 and YR52: smarca4a50/a50 retinal samples at 36 and 52 hpf respectively; WR36 and WR52: WT retinal samples at 36 and 52 hpf respectively. Note that fold change was only one of the criteria for significance inference in the original study; see (C) and Methods for details. (B) A heatmap of the corresponding retinal comparisons in the in situ hybridization samples as in (A). Even though all samples for the same gene were stained for the same time, it was decided the best usage of the in situ hybridization results was for a qualitative evaluation of differential expression. An over-expression was represented as red (1), no change as black (0) and under-expression as green (-1). (C) An identity matrix of the microarray results compared with the in situ hybridization results. An identical observation between the two studies is defined as either both the microarray comparison was significant and the in situ hybridization comparison showed a corresponding differential expression, or both the microarray comparison was insignificant and the corresponding in situ hybridization did not show a differential expression. A significant microarray result is defined as the specific contrast for that comparison was significant and the corresponding fold change is > = 2 (See Methods and [12]). White colour indicates that the expressions are identical (Y: yes) between microarray and in situ hybridization while black indicates otherwise (N: no).

