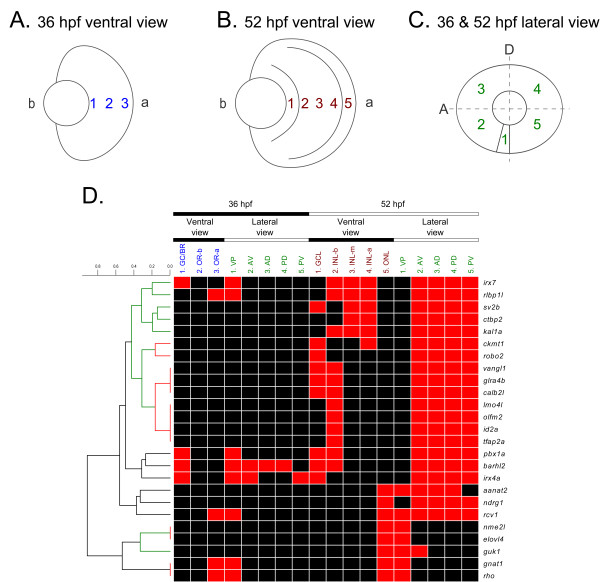
Figure 2.
Hierarchical clustering of the cellular expression patterns of 25 Smarca4-regulated retinal genes in WT retinas. Twenty five out of the 27 Smarca4-regulated retinal genes had a signal intensity that was sufficiently high for discerning their normal cellular expression domains in WT retinas at 36 and 52 hpf unambiguously. The retinas at these stages were artificially divided into several domains (A, B & C) and positive expression in that region scored. The resulting observations are plotted as a heatmap, with red colour representing a positive signal in a particular retinal domain and black representing no discernible signal. The columns are arranged according to the expression domains as defined in (A, B & C). A hierarchical clustering was conducted to elucidate the similarity of the cellular expression patterns of these genes (D). The resulting dendrogram of the clustering is plotted on the left side of the heatmap and the rows of the heatmap are arranged accordingly. The highly significant clades of the dendrogram are shown in red (p-value < 0.05) and green (p-value < 0.1).

