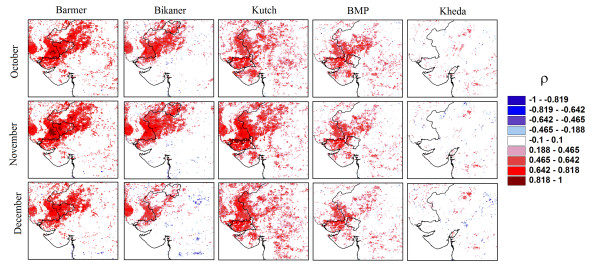
Figure 2.
Correlation maps. Spearman rank correlation (ρ) between malaria incidence from October to December and September NDVI, for each location (8 × 8 km grid point) of the study area. Each location (pixel) then represents the correlation in time between NDVI at this location and malaria incidence from a specific district. This boundary of this district is indicated inside each map. A high spatial correlation is observed over a large regional area (including the Thar desert), especially for the driest and weakly irrigated districts.

