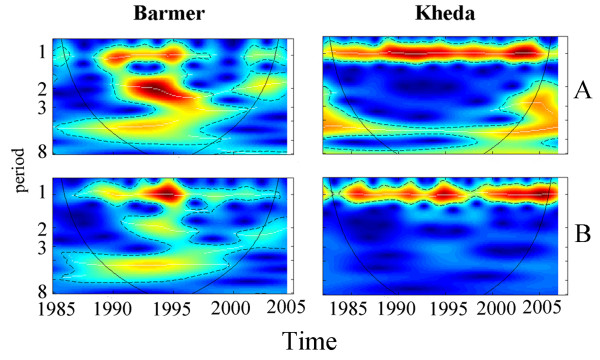
Figure 4.
Wavelet power spectrum for malaria incidence and NDVI. The wavelet power spectra of the cases (panel A) and NDVI (panel B) are shown for Barmer and Kheda, the two districts at the extremes of the irrigation gradient (for the rest of the districts see Additional file 6, Figure S6). The wavelet spectrum shows the variance (technically the power) for different periods (y-axis) and for different years (x-axis). The scale ranges from blue to red, with red indicating high power at a particular year and period. As irrigation increases, the 1-year period becomes stronger and the 2 and 4-year periods become weaker.

