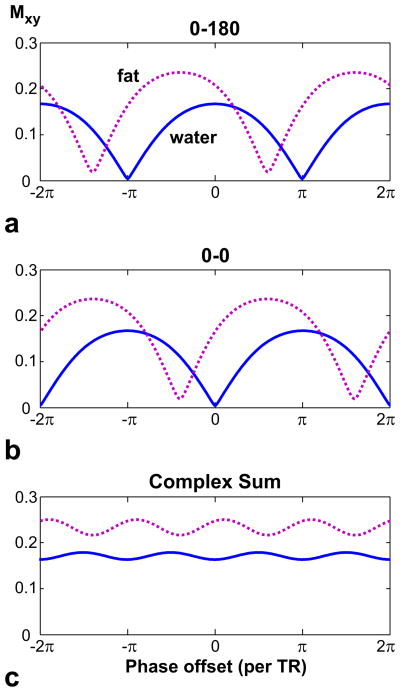
Figure 3.
The spectral profiles for fat (dotted line, T1/T2 = 260/80 ms) and water (solid line, arterial blood - 1273/254 ms) are displayed for α = 90° and TR = 10 ms, assuming a chemical shift of −220 Hz for fat at 1.5 T. The spectral axis represents the phase offset per TR due to field inhomogeneity only. a: For (0–180) ° phase-cycling, the center of the fat and water profiles are not aligned. Therefore, the fat and water signals experience considerably different magnitude weightings around a signal null. This can lead to the failure of the IDEAL reconstruction. b: A (0-0) ° phase-cycling shifts all profiles and the null locations in the frequency axis. c: A complex-summation of the two phase-cycled acquisitions removes the signal nulls to give nearly-flat profiles. Furthermore, IDEAL reconstructions can be directly applied on the resulting dataset because the phase differences are preserved.

