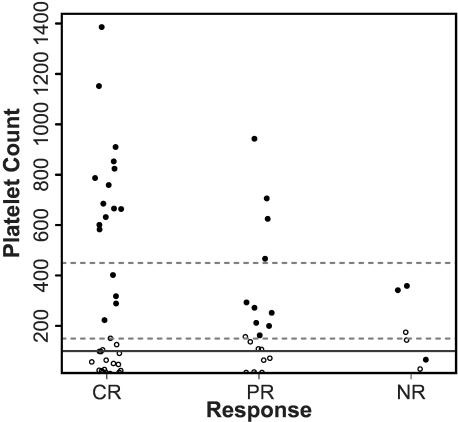
Figure 3.
Platelet count before and after decitabine-primed induction. Shown is a stripchart of pretreatment platelet counts (○) and the maximal platelet count observed at time of hematopoietic recovery (●) for subjects achieving CR, PR, or NR (NR). Dashed lines represent the extents of the normal range and the solid line is the platelet count required for CR or PR.

