Abstract
Key to understanding the morphogenetic processes that shape the early vertebrate embryo is the ability to image cells at high resolution. In zebrafish embryos, injection of plasmid DNA results in mosaic expression, allowing for the visualization of single cells or small clusters of cells 1 . We describe how injection of plasmid DNA encoding membrane-targeted Green Fluorescent Protein (mGFP) under the control of a ubiquitous promoter can be used for imaging cells undergoing neurulation. Central to this protocol is the methodology for imaging labeled cells at high resolution in sections and also in real time. This protocol entails the injection of mGFP DNA into young zebrafish embryos. Embryos are then processed for vibratome sectioning, antibody labeling and imaging with a confocal microscope. Alternatively, live embryos expressing mGFP can be imaged using time-lapse confocal microscopy. We have previously used this straightforward approach to analyze the cellular behaviors that drive neural tube formation in the hindbrain region of zebrafish embryos 2. The fixed preparations allowed for unprecedented visualization of cell shapes and organization in the neural tube while live imaging complemented this approach enabling a better understanding of the cellular dynamics that take place during neurulation.
Protocol
1.Microinjection
Dilute plasmid encoding membrane-targeted Green Fluorescent Protein (mGFP, courtesy of Richard Harland) to a concentration of 40 ng/ml. DNA is prepared by linearizing plasmid (mGFP/PCS2+, courtesy of Richard Harland) purified using the Qiagen Maxi Prep Kit. Addition of phenol red (diluted 1/10 total volume) to the solution is preferred to visualize the solution. Keep DNA solution on ice.
Under a stereomicroscope, calibrate the injection needle (90mm glass capillaries from Narishinge Scientific; Cat No. NA-GD-1) by aligning the needle on a graduated slide and gently tapping the part of the needle where the diameter is 1μm using a clean razor blade (to obtain a tip of the appropriate size).
In order to calibrate the needle to inject a known volume (2nl), connect the needle to the microinjection apparatus (PCI 100 Microinjector; Harvard Apparatus) and front fill the needle with 0.5μl of a solution containing phenol red and water placed on a piece of paraffin. The solution can be dispensed using a foot pedal. Set the pressure to 7 KPa and vary the time (10msec 30msec) so that it takes 250 pedals to dispense 0.5μl of the solution.
Carefully place the calibrated needle on a strip of wax in a humidified 100 mm Petri dish. To humidify the dish, place wet Kimwipes around the edges (this prevents evaporation of the solution in the needle).
Use a micropipette to load 0.5-1μl of DNA into the needle end (the end that was not calibrated).
Once the solution has reached the needle tip, connect the end of the needle that was used for loading to a microinjection apparatus. Adjust the settings on the microinjector to deliver approximately 2 nl/injection using a foot pedal.
Next, position zebrafish embryos in the middle of a Petri dish filled with Embryo Medium (1.0 ml Hank's Stock #1, 0.1 ml Hank's Stock #2, 1.0 ml Hank's Stock #4, 95.9 ml ddH2O, 1.0 ml Hank's Stock #5, 1.0 ml fresh Hank's Stock #6, Use about 10 drops 1 M NaOH to pH 7.2).
Once the embryos have developed to the desired stage, gently grip the chorion with fine forceps and situate the needle into the area targeted for injection. For broad range mGFP expression, inject DNA into the yolk or the cytoplasm at the 1cell stage. To restrict expression of mGFP to a smaller region, inject DNA at the 4 (or more) cells stage into the cytoplasm of a single cell.
Press the foot pedal of the microinjection apparatus and deliver approximately 2 nl, ensuring that the solution (visible due to the addition of phenol red) is properly injected.
Carefully remove the needle from the embryo.
Repeat for all embryos in the Petri dish.
Allow embryos to develop at 28.5°C to desired stage.
Dechorionate embryos by gently peeling off the chorion using fine forceps (if embryos are younger than 24hpf, dechorionating in a glass Petri dish increases the survival rate of embryos).
Remove empty chorion from the Petri dish using a glass pipette.
2. Imaging mGFP-labeled vibratome sections
Use a glass pipette to transport embryos into fixative (4% paraformaldehyde in 1X phosphate buffer solution (PBS). Fix embryos at 4°C overnight.
Wash embryos in 1X PBS 3 times for 5 minutes each.
Place the embryos in Petri dish and, using fine forceps, remove the yolk without damaging the embryo. Remove as much yolk as possible.
Prepare 4% low-melt agarose in H2O.
Place molten agarose into plastic sectioning mold.
Use fine forceps to lift an injected embryo from the Petri dish and to place and orient in the agarose. The embryo should be positioned towards one end of the mold.
Once the agarose is hardened, use a flat surface tool, such as a spatula, to remove the agarose block from the mold.
Cut the bottom end of the agarose block with a razor blade so that it is even.
Add a drop of super glue to the vibratome stage and place the agarose block on it (the side of the block that was leveled off with the razor should face the glue). For sectioning multiple embryos, mount several agarose-embedded specimens on the stage.
Attach the vibratome stage to the vibratome (Vibratome, Inc.).
Set the parameters of the vibratome (common settings: speed-3; thickness-50μm). If sectioning multiple embryos, align agarose blocks on the stage and ensure that the blade goes through the whole embryo but not through the entire width of the agarose blocks (such that sections corresponding to the same embryo will remain together).
Pour 1X PBS in the vibratome stage.
Section.
Once the embryos are sectioned, remove the agarose block(s) from the vibratome stage.
Carefully separate each section by cutting the back of the agarose block(s).
Use fine forceps to select desired sections and place into a 1X PBS-filled multi-well dish (use different wells for sections corresponding to different embryos).
Repeat for each embryo.
Proceed with antibody labeling, steps 19 though 23, to enhance mGFP imaging (this step may not be necessary if sections are imaged within a day or two of preparation).
Treat sections for 30 minutes at room temperature with blocking solution in 1X PBS to block non-specific binding.
Incubate sections with primary antibody (rabbit a-GFP, Invitrogen Cat No. A11122) diluted @ 1:200 in the blocking solution on a shaker for 5 hours at room temperature or overnight at 4°C.
Wash four times (10 min, 15 min, 30 min and 60 min, each) in 1% BSA/1X PBS/ 1% DMSO solution.
Treat sections with appropriate secondary antibody in blocking solution for 5 hours at room temperature or overnight at 4°C.
Wash four times (10 min, 15 min, 30 min and 60 min, each) in 1% BSA/1X PBS/ 1% DMSO solution.
Treat the sections with DAPI (0.1% DAPI in 50ml 1X PBS; Invitrogen Cat No. D1306) for 30 mins to stain the nuclei.
Wash three times in 1X PBS for 5 minutes each.
Mount on slide.
Image using confocal microscopy.
3. Live imaging
Dechorionate live, injected embryos 30 minutes before they reach the desired developmental stage. Place the embryos in sedative solution (0.01% Tricaine in Embryo Medium) for 15 min.
Place a drop of 1% agarose on a 35mm glass bottom culture dish (MatTek; Part No. P35G-o-20-C).
Allow agarose to solidify.
Heat capillary tube over flame to make 3 holes in agarose (other objects such as micropipette tips may be used to make the holes). Ensure that there is no residual agarose in the hole bottom.
Fill the Petri dish with Embryo Medium.
Use a glass pipette to place the embryo in the hole.
Next, orient the embryo using fine forceps so that the area to be imaged (dorsal head) is in contact with the glass.
Carefully transport the Petri dish to the microscope stage (place the lid over the Petri dish to prevent evaporation).
While imaging, ensure that the embryos are at 28.5°C.
4. Results
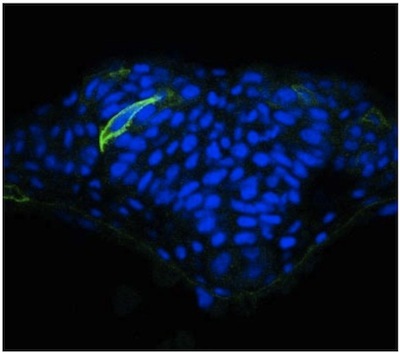
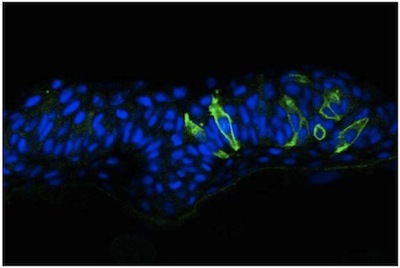
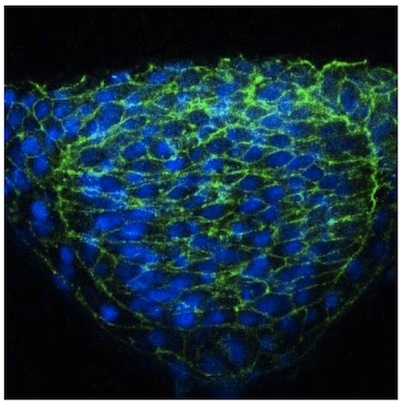
We describe here a straightforward approach to image single cells in the zebrafish neural tube using mosaic expression. Despite the optical transparency of the zebrafish embryo, we have found that visualization of neural cells is greatly enhanced in cross sections obtained using a vibratome. These sections are thick (50 mm) allowing for imaging of cellular extension from a given cell in different focal planes using a confocal microscope. Results using this methodology have been published elsewhere 2, but representative images of cells in the neural tube of a WT embryo (Figure 1) and an N-cadherin (N-cad) mutant (Figure 2) are provided. The latter reveals that cells in lateral regions of the neural plate in N-cad mutants fail to orient properly towards the midline (Figure 2). In contrast to this mosaic labeling, immunostaining the neuroepithelium with a general cell surface marker such as beta-catenin does not allow the morphology of individual cells to be visualized (Figure 3).
Time lapse imaging of live embryos complemented the mosaic labeling of fixed specimens, enabling a better understanding of the cellular dynamics that take place during neurulation. Movie 1 revealed that WT cells actively migrate towards the midline by extending medially-oriented membrane protrusions.
 Figure 1. mGFP expression in the neural tube of a WT zebrafish embryo.
 Figure 2. mGFP expression in the neural tube of a N-cadherin zebrafish embryo.
 Figure 3. b-catenin immuno staining of the neuroepithelium.
Discussion
In conclusion, the labeling techniques described here allow for single cell analysis of morphogenetic processes in the zebrafish embryo. The primary emphasis of this protocol is on methods for imaging labeled cells in the neural tube using mGFP under the control of a ubiquitous promoter. For additional applications of this transient expression assay readers should refer to a recent paper by Andersen et al.3.
Disclosures
No conflicts of interest declared.
Acknowledgments
This work was supported by an NIH grant awarded to R. Brewster (1R01GM085290-01A1 ).
References
- Nüsslein-Volhard C, Dahm R. Zebrafish Practical approach series. Oxford University press; 2002. [Google Scholar]
- Hong E, Brewster R. N-cadherin is required for the polarized cell behaviors that drive neurulation in the zebrafish. Development. 2006;133:3895–3905. doi: 10.1242/dev.02560. [DOI] [PubMed] [Google Scholar]
- Andersen E, Asuri N, Clay M, Halloran M. Live Imaging of Cell Motility and Actin Cytoskeleton of Individual Neurons and Neural Crest Cells in Zebrafish Embryos. J Vis Exp. 2010 doi: 10.3791/1726. [DOI] [PMC free article] [PubMed] [Google Scholar]


