Abstract
Enzymatic N2 reduction proceeds along a reaction pathway comprised of a sequence of intermediate states generated as a dinitrogen bound to the active-site iron-molybdenum cofactor (FeMo-co) of the nitrogenase MoFe protein undergoes six steps of hydrogenation (e−/H+ delivery). There are two competing proposals for the reaction pathway, and they invoke different intermediates. In the ‘Distal’ (D) pathway, a single N of N2 is hydrogenated in three steps until the first NH3 is liberated, then the remaining nitrido-N is hydrogenated three more times to yield the second NH3. In the ‘Alternating’ (A) pathway, the two N’s instead are hydrogenated alternately, with a hydrazine-bound intermediate formed after four steps of hydrogenation and the first NH3 liberated only during the fifth step. A recent combination of X/Q-band EPR and 15N, 1,2H ENDOR measurements suggested that states trapped during turnover of the α-70Ala/α-195Gln MoFe protein with diazene or hydrazine as substrate correspond to a common intermediate (here denoted I) in which FeMo-co binds a substrate-derived [NxHy] moiety, and measurements reported here show that turnover with methyldiazene generates the same intermediate. In the present report we describe X/Q-band EPR and 14/15N, 1,2H ENDOR/-HYSCORE/ESEEM measurements that characterize the N-atom(s) and proton(s) associated with this moiety. The experiments establish that turnover with N2H2, CH3N2H, and N2H4 in fact generates a common intermediate, I, and show that the N-N bond of substrate has been cleaved in I. Analysis of this finding leads us to conclude that nitrogenase reduces N2H2, CH3N2H, and N2H4 via a common A reaction pathway, and that the same is true for N2 itself, with Fe ion(s) providing the site of reaction.
Nitrogen fixation — the reduction of N2 to two NH3 molecules — is essential for all life, with the lives of over one-half of today’s human population depending on biologically fixed nitrogen.1 Biological nitrogen fixation, which requires energy in the form of MgATP, is catalyzed by the enzyme nitrogenase according to the limiting stoichiometry:2,3
| (1) |
There are three types of nitrogenases,4 with the best-characterized and most prevalent being the Mo-dependent enzyme studied here.3,5,6 It consists of two components, denoted the Fe protein and the MoFe protein. The former delivers electrons to the catalytic MoFe protein, which contains two remarkable metal clusters, the N2 binding/reduction active site, the iron-molybdenum cofactor ([7Fe-9S-Mo-X-homocitrate]; FeMo-co, Fig 1), and the [8Fe-7S] P cluster, which is involved in electron transfer to FeMo-co.3,5
Fig 1.
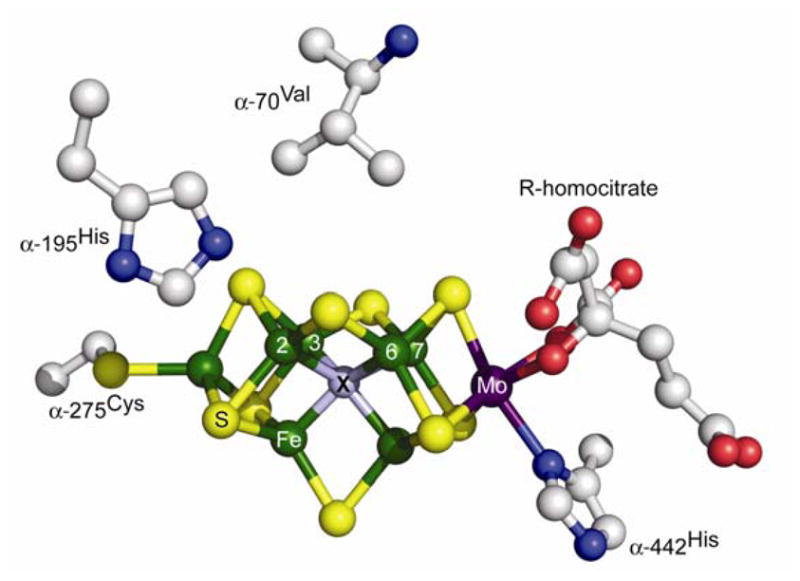
Structure of FeMo-co showing Fe green, Mo purple, S yellow, X, grey.
N2 reduction by nitrogenase proceeds along a reaction pathway comprised of the sequence of intermediate states generated as a dinitrogen bound to FeMo-co undergoes six steps of hydrogenation (e−/H+ delivery),2,3,5–8 as schematized in the Lowe-Thorneley kinetic model for nitrogenase function.3,9,10 We note that one can further consider whether electron/proton delivery at each stage is coupled or sequential, thereby possibly introducing additional intervening intermediates,11 but such issues are beyond the scope of this report.
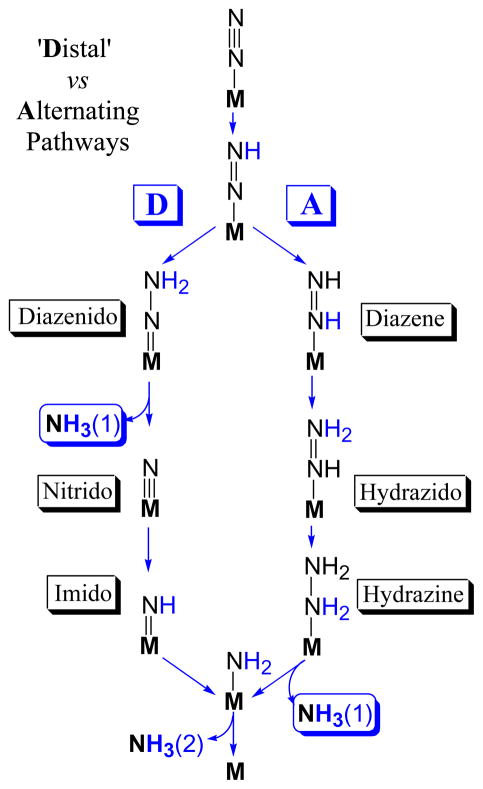
Two competing proposals for the reaction pathway have long been considered.3,6,12 They invoke distinctly different intermediates, Scheme 1, and computations suggest they likely involve different metal-ion sites on FeMo-co.12 In the ‘Distal’ (D) pathway, followed by N2-fixing inorganic Mo complexes11 and suggested to apply in reaction at Mo of FeMo-co,13 a single N of N2 is hydrogenated in three steps until the first NH3 is liberated, then the remaining nitrido-N is hydrogenated three more times to yield the second NH3. In the ‘Alternating’ (A) pathway that has been suggested to apply to reaction at Fe of FeMo-co,14 the two N’s instead are hydrogenated alternately, with a hydrazine-bound state generated upon four steps of hydrogenation and the first NH3 only liberated during the fifth step. Simple arguments can be made for both pathways. For example, the A route is suggested by the fact that hydrazine is both a substrate of WT nitrogenase and is released upon acid or base hydrolysis of the enzyme under turnover,3,8,15 and is favored in computations with reaction at Fe,12,14 while the D route is suggested by the fact that the only inorganic complexes that catalytically fix N2 employ Mo and function via the D route,11 which is computationally favored for reaction at Mo.12 As shown by Scheme 1, characterization of catalytic intermediates can distinguish between the two competing pathways.
Scheme 1.
Nitrogenase reduction intermediates had long eluded capture until we5,16,17 described the freeze-trapping and ENDOR spectroscopic studies of a number of them, each of which shows an EPR signal arising from an S = ½ state of the FeMo-co, rather than the S = 3/2 state of resting-state FeMo-co.5 These include intermediates formed during the reduction of alkyne substrates,18 the reduction of H+ under Ar,19 and finally, four associated with N2 fixation itself.17,20–24 These four include a proposed early (e) stage of the reduction of N2, e(N2), obtained from wild-type (WT) MoFe protein with N2 as substrate,16 and three putative ‘mid-stage’ or late-stage intermediates that are the subject of this study: m(NH=N-CH3), obtained from α-195Gln MoFe protein with CH3-N=NH as substrate;23 m(NH=NH), obtained from the doubly substituted, α-70Ala/α-195Gln MoFe protein during turnover with in situ-generated NH=NH,17 and a ‘late’ stage, l(N2H4), from the α-70Ala/α-195Gln MoFe protein during turnover with H2N-NH221 as substrate.
Both hydrazine and diazene are substrates of wild-type nitrogenase that, like N2, are reduced to ammonia.3,17,21 Substitution of the α-70Val residue by α-70Ala opens up the active site in the vicinity of an Fe ion at the waist of FeMo-co, Fe6, to accommodate larger substrates, increasing the rate of ammonia formation when either hydrazine or diazene is the substrate,5 and, implicating Fe as the site of substrate binding. Substitution of the α-195His residue by α-195Gln, alone or in combination with the α-70Ala substitution, is thought to disrupt the delivery of protons for reduction of nitrogenous substrates,25 and facilitate the accumulation of intermediates.5 Recently, a combination of X/Q-band EPR and 15N, 1,2H ENDOR measurements suggested that m(NH=NH) and l(N2H4) formed during turnover of the α-70Ala/α-195Gln MoFe protein with diazene or hydrazine as substrate correspond to a common intermediate (here denoted I) in which FeMo-co binds a substrate-derived [NxHy] moiety.17 However, whether or not the N-N bond in I had been broken (x = 1 or 2) was not established. The capture of a common intermediate would indicate that diazene and hydrazine both enter and ‘flow through’ the normal N2-reduction pathway (Scheme 1), and that the diazene-derived intermediate is not ‘mid-stage’, but rather that diazene must have ‘caught up’ with the ‘later’ hydrazine reaction via additional steps of enzymatic hydrogenation.
In the present report we describe X/Q-band EPR and 14/15N, 1,2H ENDOR/HYSCORE/ESEEM26–28 measurements that characterize the N-atom(s) and proton(s) associated with the substrate-derived moiety of the intermediates formed during turnover with N2H2 and N2H4, and further report measurements showing that turnover with NH=N-CH3, which can be selectively 15N labeled in either nitrogen. These measurements establish that all three substrates generate a common intermediate, I, in which the N-N bond of substrate has been cleaved. Consideration of this finding allows us to evaluate whether the D or A reduction pathways (Scheme 1) describes N2 fixation by nitrogenase, and which type of metal ion, Fe or Mo, forms the reactive site.
Materials and Methods
Samples
The preparation of the MoFe α-70Ala/α-195Gln protein and the freeze-trapping of intermediates for paramagnetic resonance measurements have been described.17,21,23
Q-band CW and pulsed ENDOR experiments
CW and pulsed 35 GHz ENDOR spectra were recorded at 2 K as described previously.17,21,23 The ENDOR spectrum for a single orientation of an I = ½ nucleus (1H, 15N) is a ν± doublet centered at the nuclear Larmor frequency and split by the hyperfine coupling, A; hyperfine tensors are obtained through analysis of 2D field-frequency plots comprised of spectra collected at multiple fields across the EPR envelope.27,29 Pulsed ENDOR spectra were detected with Mims and ReMims sequences.30 Intensity of ENDOR response for Mims sequence, [π/2-τ-π/2-T(rf)-π/2-τ-detect], follows the relationship, I(A) ~ 1 − cos(2πAτ), and as a result the signals at Aτ = n, n = 0, 1, … are suppressed (‘blind spots’). ReMims sequence, [π/2-τ1-π/2-T(rf) -π/2-τ2-π - (τ1+τ2) -detect], allows using short preparation interval τ1 and study of wider range of hyperfine values without ‘blind spots’ distortions.
X-band pulsed EPR and ESEEM experiments
CW EPR measurements were performed on an ESP 300 Bruker spectrometer equipped with Oxford CF 935 cryostat. Pulsed X-band EPR measurements were carried out using a Bruker ELEXSYS E580 spectrometer with an Oxford CF 935 cryostat at 8 K. Several types of ESEEM experiments with different pulse sequences were employed, with appropriate phase-cycling schemes to eliminate unwanted features from experimental echo envelopes. Among them are two-pulse, and one-(1D) and two-dimensional (2D) four-pulse sequences. In the two-pulse experiment (π/2-τ -π -τ-echo), the intensity of the echo signal is measured as a function of the time interval τ between two microwave pulses with turning angles π/2 and π to generate an echo envelope that maps the time course of relaxation of the spin system (in ESEEM) or as a function of magnetic field at fixed τ (in field-sweep ESE). In the 2D four-pulse HYSCORE experiment (π/2-τ -π/2-t1-π-t2-π/2-τ-echo),31 the intensity of the echo after the fourth pulse was measured with t2 and t1 varied and τ constant. The length of a π/2 pulse was nominally 16 ns and a π pulse 32 ns. The repetition rate of pulse sequences was 1000 Hz. HYSCORE data were collected in the form of 2D time-domain patterns containing 256×256 points with steps of 20 or 32 ns. Spectral processing of ESEEM patterns, including subtraction of the relaxation decay (fitting by polynomials of 3–6 degree), apodization (Hamming window), zero filling, and fast Fourier transformation (FT), was performed using Bruker WIN-EPR software.
Results
In describing results we will employ the original notation, m(NH=NH), m(NH=N-CH3), and l(N2H4), when it is helpful in specifying the origin of a sample and/or its isotopic composition for ENDOR/HYSCORE measurements. As these in fact represent a common intermediate, when discussing properties we will commonly refer to it as I.
X- and Q-band EPR
EPR spectra of α-70Ala/α-195Gln trapped during turnover in the presence of N2H4 and N2H2 reveal a complete disappearance of the resting state spectrum and the presence of the low spin signal with almost axial g-tensor characteristic of the I intermediate. For completeness, we note that the high field part of the I spectrum is overlapped with the rhombic signal of the reduced 4Fe4S cluster of the Fe protein, g = [2.05, 1.94, 1.86]. As shown earlier, the spectrum of I is the sum of contributions from two conformers.17 X-band and Q-band spectra of the m(NH=N-CH3) intermediate formed by turnover of CH3N2H with α-70Ala/α-195Gln MoFe protein likewise show the presence of two major conformers and their g-values are indistinguishable from those of the l(N2H4), suggesting that enzymatic turnover with methyldiazene likewise generates intermediate I.
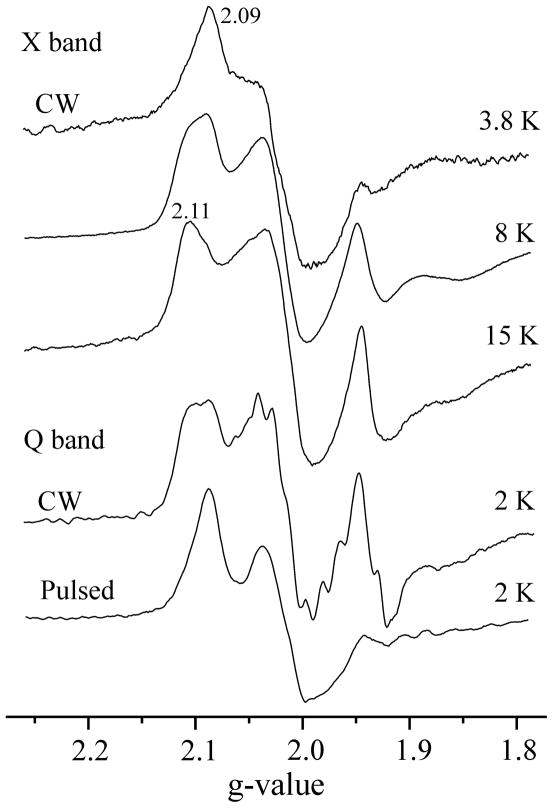
We have also extended the characterization of the spin properties of I. The temperature and microwave power dependences of the l(N2H4) signal show that the two major conformers of the EPR-active FeMo-co in I have significantly different relaxation properties, Fig 2. At temperatures below 8 K the X-band signal is dominated by a conformer with g = [2.09, 2.01, 1.98] (g1 = 2.09 signal), Fig 2. As the temperature is increased to T ~ 15 K, the EPR signal from a second conformer with g1 = 2.11 becomes dominant. The signal intensity decreases at still higher temperatures, disappearing above T ~ 30 K.
Fig 2.
EPR spectra of intermediate I (l(N2H4)) detected by various techniques. Conditions for CW X-band: microwave frequency, 9.38 GHz; microwave power, 10 mW; modulation amplitude, 7 G; time constant, 160 ms; field sweep speed, 20 G/s. Conditions for CW Q-band: microwave frequency, 35.08 GHz; microwave power, 32 μW; modulation amplitude 4 G; time constant, 128 ms; field sweep speed, 17 G/s. Conditions for pulsed Q-band: microwave frequency, 34.79 GHz; Mims sequence, π/2 = 50 ns, τ = 600 ns; repetition time 10 ms, 50 shots/point; field sweep speed, 8 G/s.
Q-band CW spectra collected at T = 2 K show signals from both major conformers at high microwave power. As the power is lowered, the g1=2.11 signal progressively becomes more prominent. At the microwave power settings used for 2 K Q-band CW 1H ENDOR measurements, the conformers contribute roughly equally to the EPR spectrum, Fig 2. In contrast, the 2 K Q-band echo-detected EPR spectrum collected with the short repetition times (~ 10 ms) used for 15N Mims pulsed ENDOR experiments is dominated by the g1 = 2.09 conformer, which thus governs these ENDOR measurements. The contribution of the g1 = 2.11 conformer becomes more noticeable with longer repetition times (~ 50 ms) but remains substantially lower in intensity.
Based on the temperature dependence of the CW X-band EPR spectra, Fig 2, it is likely that the two conformers contribute roughly equally at the temperatures used to collect X-band HYSCORE spectra, T ≈ 8 K. For completeness, Fig S1 shows the X-band field-sweep two-pulse ESE spectrum. It is a broad line between 322.0 mT and 382.0 mT with two maxima around 345.0 mT and 360.0 mT corresponding to g = 2.01 and 1.926, respectively. The relative intensities of two maxima varied slightly in different samples used in this work, presumably because of slight variations in the ratio of Fe to MoFe proteins.
35 GHz 1H CW and 2H pulsed ENDOR
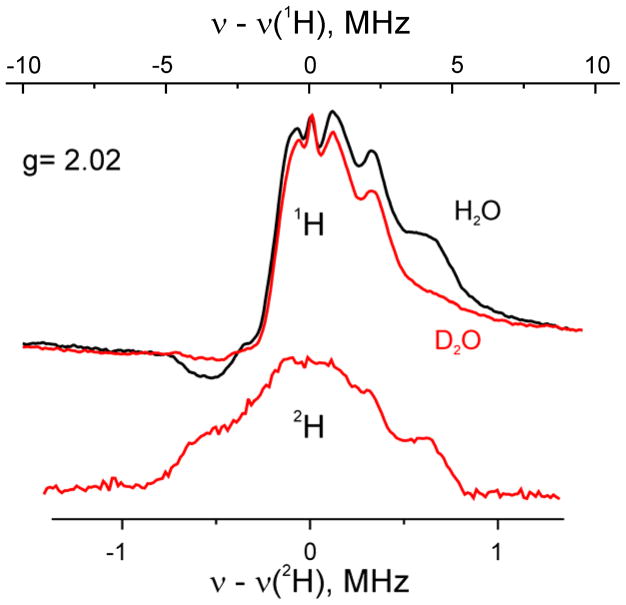
The 35 GHz CW 1H ENDOR spectra at g = 2.02 for l(N2H4) in H2O buffer show a peak corresponding to the higher-frequency, ν+, branch of the doublet for a proton(s) with A(1) ~ 8 MHz, a shoulder from a proton(s) with A(2) ~ 6 MHz, and a central, poorly resolved signal with breadth of ~ 4 MHz. The ν− branch of the H1 and H(2) spectra are respectively distorted and absent, common observations in such low-temperature spectra. When l(N2H4) is prepared in D2O buffer, the H1 signal is lost, and instead is visible in the 2H Mims pulsed ENDOR spectrum, Fig 3. Although the 2H spectrum has a hint of a ν+(2) feature, suggesting H(2) likewise is exchangeable, the H(2) shoulder is not lost from the sample prepared in D2O buffer, so we conclude that H(2) is not exchangeable. In addition, although the majority of the central peak is not lost with D2O buffer, and hence not exchangeable, the 2H spectrum shows that a fraction of it does exchange. The coupling, A(1) decreases as the field is increased/decreased towards g3/g1. At these single-crystal orientations the signals are strongly overlapped with broad peak of weakly coupled protons, and minimum hyperfine coupling can only be roughly estimated as A(1)min ≲ 6 MHz. The poor resolution of the H1 ENDOR signals likely arises from the presence of multiple slightly inequivalent H1 protons plus the presence of two distinct conformers. The maximum component of the hyperfine tensor, A(1)max ~ 9 MHz, occurs at g ~ 2.05 (Fig S2). If the field dependence of the poorly resolved H1 ENDOR pattern is considered to be associated with an anisotropic interaction of the dipolar form the polar angle between dipolar direction and g1 is estimated to be θ~ 45°.
Fig 3.
35 GHz CW 1H ENDOR spectra of I (l(N2H4)) obtained at g = 2.02 for samples prepared in H2O (black) and D2O (red) buffers. The lower spectrum shows pulsed 2H ENDOR detected for D2O sample. Conditions for CW ENDOR: microwave frequency, 35.002 GHz (H2O), 35.096 GHz (D2O); modulation amplitude, 2.5 G; time constant, 64 ms; bandwidth of RF broadened to 100 kHz; RF sweep speed, 1 MHz/s, 80 scans; temperature, 2 K. Conditions for pulsed ENDOR: microwave frequency, 34.886 GHz; Mims sequence, π/2 = 52 ns, τ = 452 ns; RF 73 μs; repetition time 12 ms, 16 shots/point, 32 scans; temperature, 2 K.
9 GHz 1,2H ESEEM/HYSCORE
Weak hyperfine couplings of the protons around FeMo-co and 4Fe4S centers were studied using orientation-selective two-dimensional ESEEM, called HYSCORE. The HYSCORE experiment creates off-diagonal cross-peaks (να, νβ) and (νβ, να) from each I = 1/2 nucleus in 2D spectrum. Powder and orientation-selected HYSCORE spectra of I = ½ nuclei reveal, in the form of cross-ridges, the interdependence between να and νβ, in the same orientations. Analysis of the ridges in (να)2 vs. (νβ)2 coordinates allows separate estimate of the isotropic (a) and anisotropic (T) components of the hyperfine tensors.32
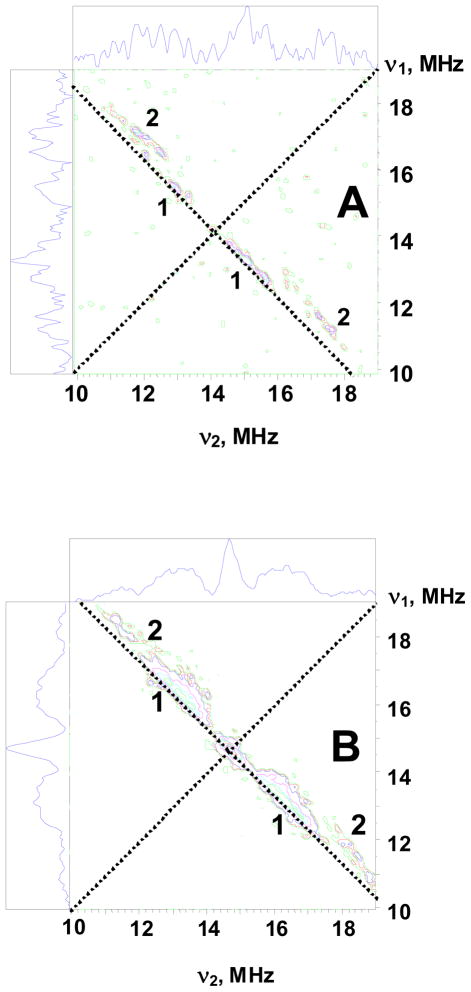
Figure 4 shows 1H HYSCORE spectra of the l (N2H4) intermediate obtained at the magnetic field 332.0 mT (g = 2.087) (Fig 4A ) and 334.5 mT (g = 2.008) (B). Spectra resolve two pairs of cross-peaks 1 and 2. Cross-peaks 2 possess larger splitting ~ 6–8 MHz and visible deviation from antidiagonal indicating a significant anisotropic hyperfine component. The intensities of the cross-peaks 2 decrease relative to those of 1 as the magnetic field is increased and cross-peaks 2 are not observed above ~ 349.0 mT (g ≲ 1.985). Cross-peaks 2 were also not observed in the spectra of the sample prepared in D2O showing that they are produced by exchangeable proton(s). As discussed in detail in SI, quantitative analysis of the cross-ridges 2 contours from the spectra recorded at different field in the coordinates (ν1)2 vs. (ν2)2 using methodology previously described33 and assuming an axial anisotropic component gives two possible solutions: T = 4.6 MHz, a = −0.2 MHz and T = 4.6 MHz, a = −4.3 MHz (signs are relative). These values for a and T correspond to A⊥ = |a−T| ~ 4.8 MHz and A|| = |a+2T| ~ 9 MHz for the first solution, and A⊥ ~ 9 MHz and A|| ~ 4.8 MHz for the second. The second solution is consistent with the observation in Q-band ENDOR of an exchangeable proton(s) with maximum coupling, A(1)max ~ 9 MHz and minimum coupling, A(1)min ≲ 6 MHz. Cross-peaks 1 correspond to the non-exchangeable proton shoulder seen in Q-band ENDOR and associated with the protein.
Figure 4.
Contour presentations of the 1H HYSCORE spectra of the l(N2H4) intermediate (magnetic field 332.0 mT (A) and 345.0 mT (B), time between first and second pulses τ=136 ns, microwave frequency 9.6982 GHz).
Additional information about the exchangeable proton(s) was sought from 1D four-pulse 1H ESEEM spectra.. Such spectra contain lines in the region of the double proton Larmor frequency (2νH ~ 28–29 MHz) that are sum-combination harmonics (να + νβ) of two basic frequencies να and νβ. As presented in SI, analysis of these harmonics shows the existence of protons with the same anisotropic coupling as found for the exchangeable protons by HYSCORE.
35 GHz 15N ReMims ENDOR
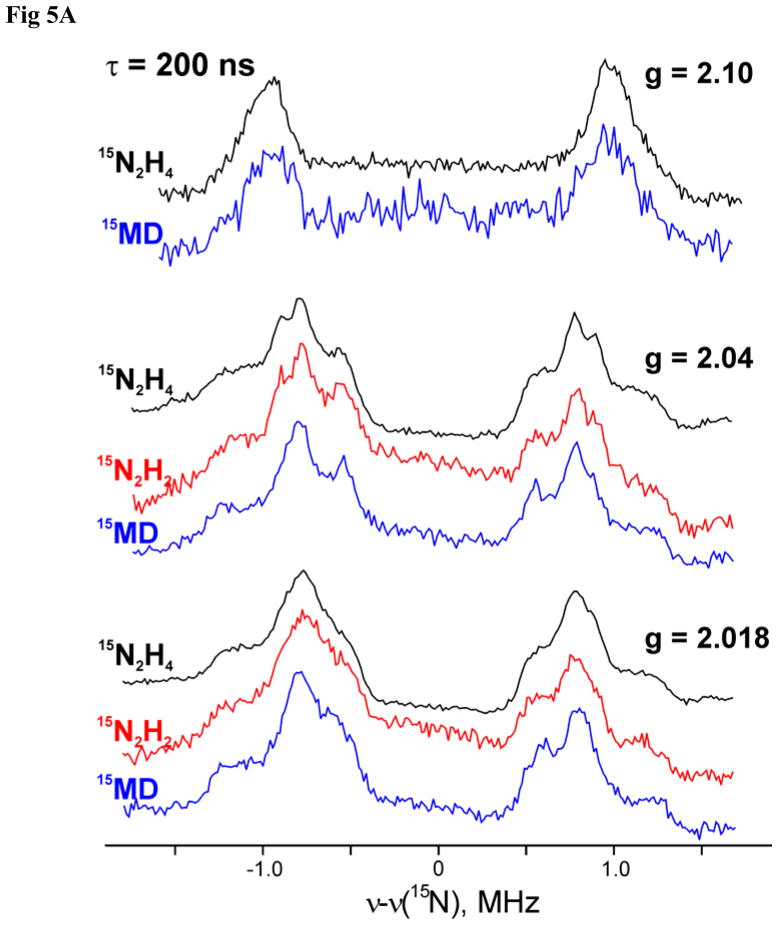
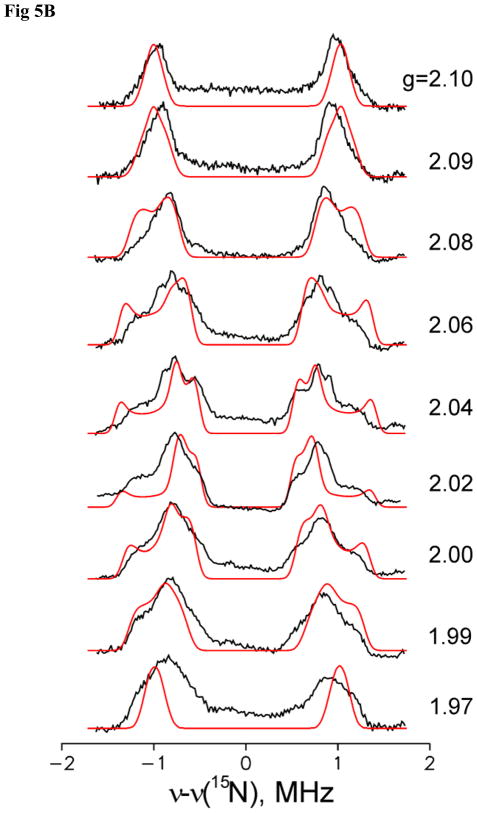
Figure 5A presents pulsed 15N ENDOR spectra collected at the three canonical g-values for the intermediates trapped during turnover with the three isotopically labeled substrates, N2H2, CH3N2H, and N2H4, and Fig 5B presents a 2D field-frequency plot of pulsed 15N ENDOR spectra collected across the EPR envelope of l(15N2H4) prepared from the α-70Ala/α-195Gln MoFe protein by freeze-quench during turnover in the presence of 15N2H4. Spectra were collected with the ReMims30 pulse sequence. This permitted measurements with τ1 = 200 ns, which eliminates Mims ENDOR ‘blind spots’ from the frequency range of the scan. Wider ENDOR scans collected for l(15N2H4) showed no 15N signal with a hyperfine coupling greater than the maximum for N1, A3 = 2.7 MHz.
Figure 5.
(A) Comparaion of 35 GHz ReMims pulsed 15N ENDOR spectra of intermediates trapped during turnover of the α-70Ala/α-195Gln MoFe protein with 15N2H4, 15N2H4, and 15NH=N-CH3 (denoted 15MD). (B) 2D Field-Frequency plot of 35 GHz pulsed 15N ENDOR spectra of l(15N2H4) intermediate. Conditions: microwave frequency, 34.82 GHz; ReMims sequence, π/2 = 30 ns, τ1 = 200 ns; RF 40 μs; repetition time, 10 ms; 500–950 scans; temperature, 2 K. Spectral baselines were corrected by simple subtraction if needed. Simulation (red) parameters: g = [2.09, 2.015, 1.98], hyperfine tensor A = [1.0, 2.8, 1.5] MHz, Euler angles ϕ = 50°, θ= 60°, ψ = 55° with respect to g-frame.
The spectra for the three intermediates are essentially identical, Fig 5A. The observed 2D 15N ENDOR patterns, as shown for l(15N2H4), Fig 5B, is consistent with the presence of a single type of 15N. As shown in the figure, the 2D pattern can be described moderately well by simulations that assume a single 15N with hyperfine tensor, A(15N1) = ±[1, 1.5, 2.8] MHz, |aiso(15N1)| = 1.8 MHz, corresponding to A(14N1) = ± [0.7, 1.1, 2] MHz, |aiso(14N1)| = 1.3 MHz. The observation of an isotropically coupled, substrate-derived 15N signal, in conjunction with the observation of the exchangeable H1 ENDOR signal, establishes the presence of a substrate-derived [NxHy] moiety bound to metal ion(s) of the cofactor of I. These pulsed-ENDOR measurements were performed at T = 2 K with a 10 ms repetition time. As shown in Fig 2, the EPR spectrum collected under these conditions is dominated by the g1 = 2.09 conformer. Thus, the 15N1 hyperfine tensor derived from the ReMims pulsed ENDOR measurements are assigned to this conformer, whose g tensor was used in the simulation.
The imperfections to the simulations in Fig 5B in terms of a single 15N1 associated with each FeMo-co can be attributed to a combination of two factors: a distribution in the N1 tensor values for the g1 = 2.09 dominant conformer; a contribution from the 15N1 associated with the g1 = 2.11 conformer, whose contribution to the EPR spectrum can be discerned in Fig 2. The 15N ENDOR spectra of m(15NH=N-CH3), Fig 5A, confirm that the spectra do not instead arise from an overlap of signals from two nearly equivalent 15N associated with each FeMo-co. The original study of this intermediate,23 which employed the α-195Gln-substituted MoFe protein not the double mutant employed in this study, showed that when m(15NH=N-CH3) is formed from 15NH=N-CH3 it exhibits a 15N signal comparable to those of N2H4 and N2H2, but with a slightly smaller coupling, |aiso(15N1)| ≈ 1.5 MHz. To assure proper comparisons, we here examine m(15NH=N-CH3) generated with the α-70Ala/α-195Gln MoFe protein, as with the other two substrates.
The EPR signal of m(15NH=N-CH3) prepared with the α-70Ala/α-195Gln MoFe protein is reported above to be the same as that of I, and Fig 5A likewise demonstrates that the ReMims ENDOR spectra of m(15NH=N-CH3) are the same as those of I formed with 15N2H4 and 15N2H2. The EPR and ENDOR results together therefore establish that turnover with methyldiazene also generates the common intermediate, I. As there is only one 15N in this substrate, the 15N signal for I cannot come from two nearly equivalent 15N associated with each FeMo-co, and must come from contributions from two conformers, each with a single 15N bound to FeMo-co.
We may further conclude that the slight differences in hyperfine parameters for m(15NH=N-CH3) prepared with the α-195Gln and the α-70Ala/α-195Gln MoFe proteins result from secondary influences, that turnover of NH=N-CH3 indeed forms the common intermediate, I. With this identification, the previous study of I then further confirms that the signals of Fig 5A arise from a single 15N bound to FeMo-co in each of two conformers: when I is formed from NH=15N-CH3 there is no such 15N signal. The use of NH=N-CH3 isotopomers thus proves that either the N-N bond has been cleaved in I, or an N2Hx moiety from substrate binds end-on.
15N Mims ENDOR
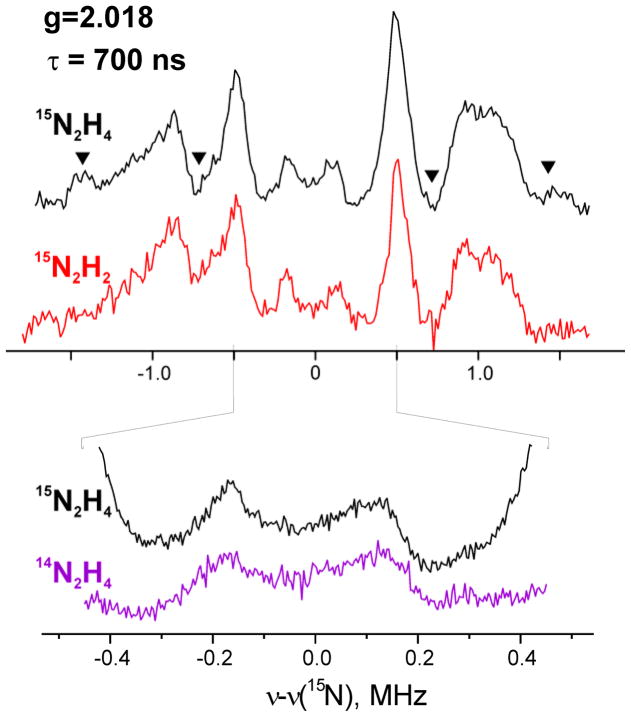
To test for end-on binding of N2Hx, we examined the intermediates l(15N2H4) and, m(15N2H2) for the presence of a second 15N derived from substrate, but with a smaller coupling than for N1, by collecting Mims ENDOR scans with a large pulse interval, τ. Although the signal from the latter sample is weaker, it is indistinguishable from that of the former, in keeping with the assignment of both to I. The intensity of the Mims ENDOR response for a signal with hyperfine coupling, A (MHz), depends on τ(μs) through the function, I(τ) ~ 1−cos(2πAτ). When Aτ = n, the intensity is null and ‘blind spots’ appear in the ENDOR spectrum, as seen in the Mims spectrum taken for 15N1 with τ = 700 ns, Fig 6. However, in parallel, I(τ) shows sensitivity maxima at Aτ = n+1/2 and overall gives the best sensitivity at Aτ ≈ ½. Thus, as τ is progressively increased, the measurements become progressively more sensitive to smaller values of A. As this is a relative sensitivity, measurements were performed at the maximum of EPR signal intensity (g2).
Figure 6.
35 GHz Mims 15N ENDOR spectra detected at the maximum of EPR signal intensity (g2 = 2.018) for l(15N2H4) (black) and m(15N2H2) (red) intermediates. Expanded spectra, below, compare region around 15N Larmor frequency for l(15N2H4) (black) and l(14N2H4) (purple) Spectra are shown after simple baseline correction; triangles represent distortions induced by “blind spots” of Mims ENDOR. Conditions: microwave frequency, ~ 34.82 GHz; Mims sequence, π/2 = 50 ns, τ = 700 ns; RF 40 μs; repetition time, 10 ms; 800–3800 scans; temperature, 2 K.
Setting τ = 700 ns in the Mims sequence, Fig 6, not only introduces the holes in the 15N1 spectra of l(15N2H4) and m(15N2H2), but also causes what appears to be a 15N doublet from a second, weakly-coupled 15N from substrate, centered at νN, with A(15N2) ~ 0.1 MHz. However, this signal remains unchanged when a corresponding spectrum is collected for l(14N2H4) (and m(15N2H2), not shown) prepared from 14N2H4 substrate. Thus, this ENDOR response is not associated with a second, weakly coupled 15N2 of substrate, and instead can be assigned as a double-quantum transition from 14N associated with the MoFe protein. The narrow τ = 700 ns scan, collected with extremely high signal/noise, shows no trace of any 15N ENDOR response from a weakly coupled 15N. Considering the example of nitrile hydratase (NHY)34 where a weakly coupled 15N (A < 0.05 MHz) is reliably detectable, one can conclude that hyperfine couplings ratio for metal-bound 15N1 and a possible second 15N2 of substrate must be A(N1)/A(N2) > 40. As with the direct inferences drawn from the different isotopologs of methyldiazene, the absence of any trace of a weakly coupled 15N2 indicates that the N-N bond of substrate N2H4 has been cleaved, and the 15N1 and 1H1 ENDOR signals are associated with an [N1Hy] species.
14,15N HYSCORE
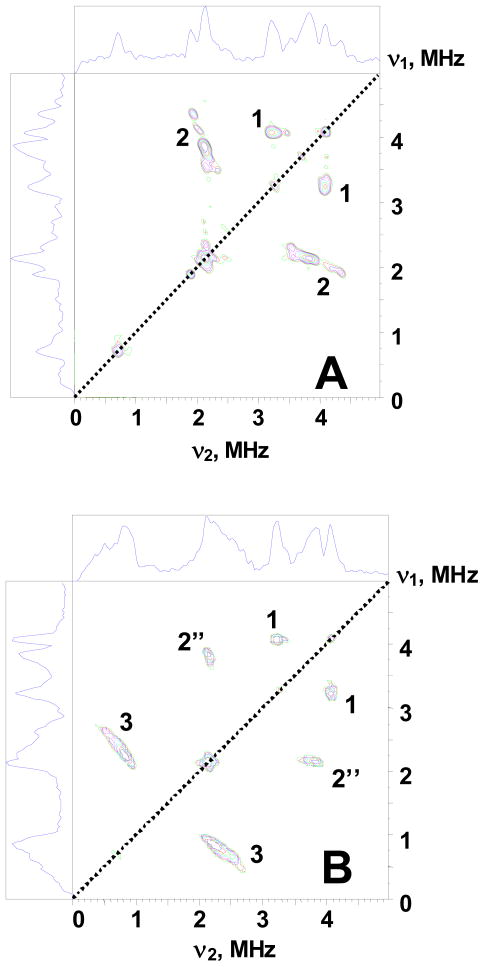
HYSCORE experiments were performed with two samples of intermediate prepared from the α-70Ala/α-195Gln substituted MoFe protein by use of 14N2H4 or 15N2H4 as substrate. Figure 7 shows representative HYSCORE spectra of two samples in the low frequency part appropriate for the weakly coupled nitrogens. These spectra are recorded at the magnetic field corresponding to the low-field maximum g = 2.01 in the EPR spectrum (Fig. S1). Spectrum of the sample with 14N2H4 (Fig 7A) shows two pairs of cross-features symmetrical relative to the diagonal. Those are extended cross-features 2 of complex shape with several maxima and cross-peaks 1 possessing symmetrical line shape with elliptic contour.
Figure 7.
Contour presentations of the 14,15N HYSCORE spectra of the l(N2H4) intermediate with 14N2H4 (A) and 15N2H4 (B) (magnetic field 345.9 mT (14N2H4) and 346.0 mT (15N2H4), time between first and second pulses τ=136 ns, microwave frequency 9.702 GHz (14N2H4) and 9.707 GHz (15N2H4).
The spectrum of l(15N2H4) (Fig 7B) shows that 15N labeling does not influence the cross-peaks 1 indicating that they are produced by protein 14N nitrogen. The labeling also leaves a pair of cross-peaks 2″ located in the area where extended cross-features 2 were observed in the spectrum of the sample with 14N2H4. This indicates that the cross-features 2 in Fig 7A result from the contribution of two different types of nitrogens. One contribution, denoted 2′, is lost in the 15N sample and is from 14N of 14N2H4; the second (2″) is from 14N associated with the MoFe protein. In keeping with this assignment, 15N nitrogens of 15N2H4 produce new cross-peaks 3 in Fig 7A, located symmetrically around the diagonal point with 15N Larmor frequency (15νN, 15νN), that correspond to the lost signal 2′.
The most important aspect of the HYSCORE spectrum Fig 7B is that there is no signal around the diagonal point from a very weakly coupled 15N, and the same is true for spectra recorded at other fields. The limit of detectability for a small coupling in HYSCORE is at least as low as that for Mims ENDOR. The absence of any trace of a weakly-coupled 15N2 in either experiments indicate that the N-N bond of substrate N2H4 has been cleaved, and the 15N1 and 1H1 ENDOR signals are associated with an [N1Hy] species. As discussed below, this conclusion is supported by earlier studies of I formed with isotopically labeled NH=N-CH3.23
HYSCORE spectra measured for l(15N2H4) at different magnetic fields show that the cross-peaks 1 are present in spectra measured in the field interval from 332.0 mT (g = 2.087) up to 364.0 mT (g = 1.90), but decay quickly at magnetic fields below g = 2.01. This suggestion that the cross-peaks 1 come from nitrogen(s) associated with the 4Fe4S center of the Fe protein was confirmed by HYSCORE examination of the isolated Fe protein. In contrast, the cross-peaks 2″ are observed from the low-field edge of the EPR spectrum (g = g1) up to 352.0 mT (g = 1.97) and the cross-peaks 3 from 15N likewise are seen in this field interval, which indicates that the 2″ and 3 (and 2′) cross-peaks are from nitrogen(s) interacting with FeMo-co of the MoFe intermediate. The width and intensity of these cross-peaks 1 and 2″ are consistent with the cross-correlation of 14N double-quantum transitions from mS = ±1/2 manifolds.
Analysis of 14N HYSCORE peaks (1, and 2″)
The frequency of double-quantum transition in powder spectra is well described by the following equation:35
| (3) |
where κ= K2(3+η2), νef± =|νN ± A/2|. We suggest that νdq± taken from the spectra obtained in the region of the intermediate g2-values, where a broad set of orientations contribute to the spectra, would allow accurate estimate of hyperfine coupling and quadrupole coupling constant K=e2Qq/4h for nitrogens producing cross-peaks 1 and 2″. The corresponding frequencies are of (4.0, 3.1) MHz for cross-peaks 1 and (3.81, 2.14) MHz for cross-peaks 2″. Rearrangement of eq 3 yields the formula:
| (4) |
This equation, together with the corresponding 14N Zeeman frequency, gives couplings A(14N) = 0.7 MHz (1) and A(14N) = 1.15 MHz (2″). Using the derived values of the hyperfine coupling one can calculate the quadrupole parameter from eq 3: κ = K2(3+η2) = 1.84 MHz2 (1) and 0.9 MHz2 (2″). Those correspond to quadrupole coupling constant (qcc) K = 0.73±0.05 MHz (1) and K = 0.5±0.04 MHz (2″), but do not permit assignment of the asymmetry parameter, 0≤η ≤1. The qcc (1) is consistent with peptide nitrogens H-bonded to the 4Fe4S cluster, which exhibit quadrupole coupling constants, K ~ 0.7–0.8 MHz.36 On the other hand, the lower value of the qcc (2″) suggests that FeMo-co centre forms a hydrogen bond with another type of nitrogen.
The cross-features 2′ and 2″ significantly overlap in forming feature 2 of the HYSCORE spectra of the l(14N2H4) intermediate, but comparison of Fig 7A and B shows that cross-features 2′ possess more a complex extended shape. However, the overlap of the 2′ and 2″ cross-peaks suggests that the values of hyperfine and quadrupole couplings for these two nitrogens are essentially the same, thereby giving for 2′, A(14N) ≈ 1.15 MHz, K ≈ 0.5±0.04 MHz for the cofactor-bound –NHy fragment. This hyperfine coupling corresponds to A(15N) ≈ 1.6 MHz, in agreement with |aiso(15N1)| = 1.8 MHz derived above from 35 GHz ENDOR spectra. The extended shape of the 2′ cross-peaks correlates with the features in the EPR and 15N ENDOR and 15N HYSCORE (see below) spectra that suggest the presence of several similar conformations of the paramagnetic center.
The estimate of K with an accuracy of ~15% allows its assignment to the particular type of nitrogens of the protein environment. Nevertheless, for a complete description of the nuclear-quadrupole interaction tensor, and its unambiguous assignment, direct determination of both quadrupole parameters, K and η, would be desirable. These values could be determined directly from ESEEM experiments satisfying the cancellation condition νef ~ 0 at one of the manifolds. For hyperfine coupling A ~ 0.67–1.0 MHz, the cancellation condition is reached at 14N Zeeman frequency νI ~ 0.35–0.5 MHz, that corresponds to the S-band experiment with microwave frequency ~ 3–4 GHz.
15N HYSCORE
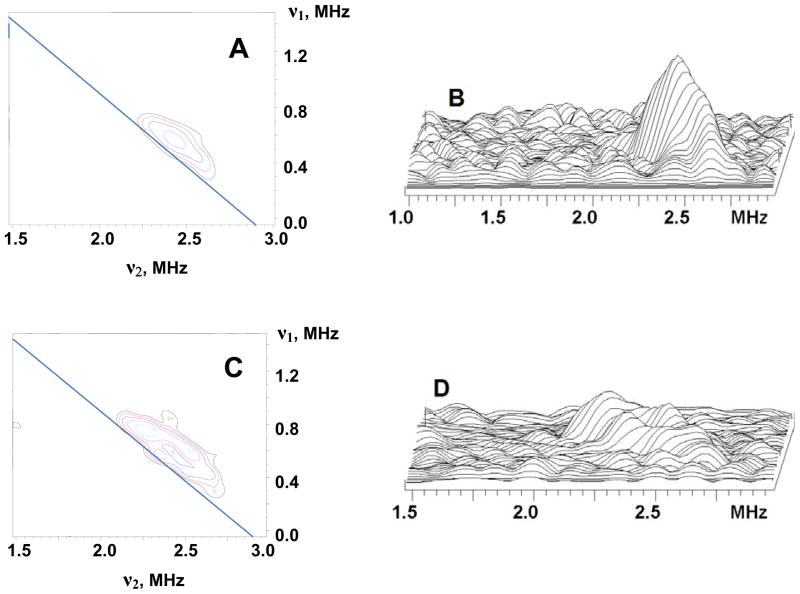
X-band HYSCORE spectra measured at different magnetic fields across the EPR spectrum of l(15N2H4) all show15N cross-features (3) centered symmetrically around the diagonal point with the 15N Zeeman frequency. Their location corresponds to the 15N hyperfine coupling ~1.5–2.0 MHz (Fig 8), in agreement with the 14N HYSCORE (2′) and 15N ENDOR results for the substrate-derived [−NHy]. The shape of the cross-peaks for 3 significantly varies with magnetic field. For instance, the cross-peak 3 in the “single-crystal-like” spectrum recorded near g1 is a peak with a single maximum and resolved additional shoulders (Fig 8A, B). In contrast, two closely located but resolved ridges are seen in the spectra recorded at the fields between g1 (low field) and g2, (maximum intensity) (Fig 8, C, D). The complicated shape of these 15N HYSCORE ridges, 3, corresponds to the extended shape of the 14N features 2′.
Figure 8.
Contour (A, C) and stacked (B, D) presentations of the cross-features 3 from the HYSCORE spectra of the l(15N2H4) intermediate (magnetic field 329.5 mT (A, B) and 332.3 mT (C, D), time between first and second pulses τ=136 ns, microwave frequency 9.7034 GHz (A, B) and 9.7057 GHz (C, D)).
The regression lines of such ridges when plotted as (να)2 vs. (νβ)2 must form a triangle with the apexes on the |να + νβ|=2νN curve for signals from a single 15N. However, the analysis presented in detail in SI shows that regression lines for the ridges from Fig 8C, D (and others) do not form such a shape, indicating that the 15N spectra are not consistent with a single nucleus. This is expected, as the ENDOR measurements described above show that metal ion(s) of FeMo-co in the intermediate bind a single nitrogen from substrate, but the intermediate exists in two conformations. The (να)2 vs. (νβ)2 analysis for the ridges located closer to and farther from to the antidiagonal in Fig 8, C, D gives the following estimate for anisotropic components for 15N1 of the two conformers, T~0.3–0.4 and 0.6–0.7 MHz, respectively. The isotropic couplings would be practically the same for both ridges with the value about 1.9–2.1 MHz or − (1.5–1.6) MHz, in satisfactory agreement with |aiso(15N1)| determined by ENDOR. The quantity, 2T, can be considered as a rough estimate of the maximum component of the anisotropic tensor for these two conformations, giving Tmax ~ 0.6–0.8 MHz and 1.2–1.4 MHz, similar to Tmax(N1) = 1.0 MHz seen in ENDOR.
Discussion/Conclusions
This report describes EPR/ENDOR/HYSCORE measurements of the common intermediate, I, formed during freeze-quench of the α-70Ala/α-195Gln substituted MoFe protein under turnover conditions using N2H4, CH3N2H, or N2H2 as substrate. We first discuss the properties of this intermediate, then incorporate the conclusions we reach into an analysis that leads us to propose that nitrogenase functions by the A reaction pathway of Scheme 1.
Nature of Intermediate I
Earlier X/Q-band EPR and 35 GHz ENDOR measurements showed that freeze-quench of the α-70Ala/α-195Gln substituted MoFe protein during turnover with N2H4 or N2H2 causes loss of the EPR signal from resting-state (S = 3/2) FeMo-co and the appearance of the signals from low-spin (S = ½) intermediates with almost axial g-tensors, originally denoted m(N2H2),17 l(N2H4),21 respectively. The properties of these intermediates, as measured in the previous work and extended in the present study, establish that they correspond to a common state: [m(N2H2), l(N2H4)] = I. The temperature and microwave power dependences of the I EPR signal indicate that the FeMo-co of this state has two major conformers with different g tensors (g1 = 2.09, 2.11) and significantly different relaxation properties.
1,2H and 15N 35 GHz CW and pulsed ENDOR measurements showed that I has an [NxHy] fragment bound to FeMo-co.17 The proton(s) associated this fragment have here been investigated by 35 GHz 2 K CW 1,2H ENDOR and X-band 8 K HYSCORE/ESEEM measurements with samples prepared in H2O/D2O buffers. At the microwave power settings used for 2 K Q-band CW 1H ENDOR measurements and at the temperature used for the HYSCORE measurements, each measurement interrogates both conformers of I with approximately equal sensitivity. The two techniques confirm that I exhibits a signal from exchangeable H1 proton(s) with a maximum hyperfine coupling, A ~ 9 MHz, and that the H1 signals can be interpreted in terms of an axial hyperfine tensor with A⊥= |a−T | ~ 9 MHz and A|| = |a+2T |~ 4.8 MHz, corresponding to T = 4.6 MHz, a = −4.3 MHz (signs are relative).
The 2 K Q-band pulsed 15N ENDOR spectra are collected with short repetition times (~ 10 ms), and are dominated by the g1 = 2.09 conformer of I. A 2D field-frequency pattern of the 15N ENDOR spectra of this I conformer can be analyzed in terms of a single bound 15N, with hyperfine tensor, A(15N1) = ±[1, 1.5, 2.8] MHz, although the spectra appear to be distorted by contributions from the single 15N1 of the second conformer. The 8 K X-band 15N HYSCORE measurements are consistent with this tensor, but the shape of the HYSCORE signal appears to represent comparable contribution from two nitrogens with very similar couplings. As the 8 K HYSCORE measurement is equally sensitive to signals from the two conformers, these experiments are consistent with the view that the 15N ENDOR and HYSCORE responses do not arise from a [15N2Hy] species with roughly equivalent 15N bound to FeMo-co, and instead each of the two slightly different 15N is associated with one of the conformers of the FeMo-co center. This interpretation is in confirmed by experiments with I formed from specifically labeled CH3-N=15N-H and CH3-15N=N-H as substrates. The 15N ENDOR signals from the single 15N of CH3-N=15N-H are identical to those of I formed from the other two substrates, Fig 5A, and no such signal is seen when CH3-15N=N-H is employed.23 These results prove that the two contributing 15N represent a single nitrogen from substrate bound to FeMo-co metal ion(s), but with properties that differ slightly in the two conformers. The 14N HYSCORE patterns for I further give the quadrupole coupling parameter for N1, K ≈ 0.5±0.04 MHz.
The conclusion that the 15N1 signals originate from a single nitrogen atom bound to a metal ion(s) of FeMo-co leads to the question of whether or not the substrate-derived species retains the N-N bond of the N2H4/N2H2 substrates. If the second N is present but not bound to a metal ion, it would have a weaker hyperfine coupling. High-resolution 35 GHz pulsed ENDOR spectra (Fig 6) show no evidence of a weakly coupled 15N2. We estimate that a second 15N2 could be present only if it had a hyperfine coupling at least forty-fold smaller than that of the observed 15N1 signal; as a comparison, preliminary results indicate that the coupling constant of the remote 15N2 of 15N2H4 bound to the ferriheme of heme oxygenase37 is roughly twenty-fold less than that of the 15N1 bound to Fe. The HYSCORE experiment likely has an even lower threshold than ENDOR for the detection of a weakly bound 15N, and it also shows no response from a second nitrogen atom. Finally, when I is trapped during turnover with the selectively labeled CH3-15N=NH, 13CH3-N=NH, or C2H3-N=NH no signal is seen from the isotopic labels.23 From these results we conclude that the N=N bonds of N2H2 and CH3N2H, and the N-N bond of N2H4 have been broken in forming the common EPR-active intermediate I during enzymatic turnover. This intermediate thus contains an [NHy] moiety bound to FeMo-co, and when useful can be denoted as I[NHy].
The Nitrogenase Reaction Pathway
Based on the alternative reaction pathways pictured in Scheme 1, the [NHy] moiety bound to FeMo-co of I could be [=NH], [−NH2], or even the product [NH3] (not shown). Given that two of the states that bind these fragments are reached by both pathways, the nature of this moiety does not in itself distinguish between A and D pathways. However, the present findings in conjunction with other considerations lead to us to propose that nitrogenase functions via the A reaction pathway of Scheme 1 for reduction of N2.
Both N2H2 and N2H4 are substrates that are reduced to two NH3 by the wild-type nitrogenase. By opening the reactive site, the α-70Ala substitution merely enhances the reduction of these substrates, while the α-195Gln substitution further favors the trapping of I[NHy]. The reduction of N2H4 must begin by its binding to FeMo-co, and this necessarily generates a state associated only with the A pathway, as there is no N2H4-bound intermediate along D. Instead, according to the D pathway, Scheme 1, the N-N bond is cleaved two stages of hydrogenation prior to the appearance of an intermediate at the formal reduction stage of N2H4. In contrast, diazenido intermediates exist on both routes. To explain how nitrogenase could reduce each of the substrates, N2, N2H2 and N2H4, to two NH3 molecules via a common A reaction pathway, one need only postulate that each substrate ‘joins’ the pathway at the appropriate stage of reduction, binding to FeMo-co that has been ‘activated’ by accumulation of a sufficient number of electrons (possibly with FeMo-co reorganization) and then proceeds along that pathway. For N2H2 to instead join the D pathway would imply that it is converted to the [NH2=N] tautomeric form upon binding to FeMo-co, a seemingly implausible process. Moreover, the strong influence of α-70Val substitutions of MoFe protein without modification of FeMo-co reactivity strongly implicate Fe, rather than Mo, as the site of binding and reactivity,19 and energetic considerations then implicate the A pathway.12 Overall, the combination of these considerations with the finding of the formation of the common intermediate I thus lead us to conclude that N2H2, CH3N2H, N2H4, all are reduced by the common A pathway.
Does that require N2 reduction to follow the same pathway? Rejection of the D pathway contradicts the suggestions of an early study8 which showed that hydrazine is released upon acid or base quenching of nitrogenase actively reducing dinitrogen.9 This finding was interpreted as indicating that the diazenido intermediate in the D pathway (Scheme 1) can be viewed as accepting two electrons from FeMo-co, making it a hydrazido dianion (N-NH22−), and that this dianionic species is protonated and released as N2H4 upon hydrolysis by either acid or base. However, it is clearly more economical38 to propose that the hydrazine observed during acid/base quenching of nitrogenase is merely released from the hydazine-bound intermediate that occurs naturally as a stage along the A pathway, Scheme 1, and that all nitrogenous substrates, N2 included, undergo reduction to two NH3 molecules by the common pathway, A. Likewise, it is most economical to suggest that both the Mo-dependent nitrogenase studied here and the V-dependent nitrogenase4 reduce N2 by the same pathway. As it has been shown that V-nitrogenase produces N2H4 while reducing N2,39 then according to Scheme 1 this enzyme clearly functions via the A pathway, implying the same is true for Mo-nitrogenase.
No nitrogenous substrate binds to resting-state (S = 3/2) FeMo-co of nitrogenase,40 so the activation of FeMo-co for each substrate requires the accumulation of some number of electrons. The most refractory substrate is N2 itself, and the Lowe-Thorneley scheme states that the accumulation of three, and most effectively four, electrons is required to bind N2 and initiate its reduction.3,9,10 Indeed, our previous work characterized the intermediate that has accumulated four electrons.19,41 Presumably, lower numbers of accumulated electrons are required to initiate reduction of N2H2 and N2H4, as is true for reduction of C2H2.3,9
Conclusions
(i) EPR/ENDOR/HYSCORE measurements establish that a common intermediate, I, is trapped during turnover of N2H2, CH3N2H, or N2H4 as substrate for the α-70Ala/α-195Gln substituted MoFe protein. These measurements reveal that I represents a stage of N2 fixation in which the N-N bond has been cleaved, and in which [=NH], [−NH2], or even the product [NH3] are bound to FeMo-co. (ii) Considerations of these findings lead us to conclude that nitrogenase reduces N2H2, CH3N2H, N2H4 via the A reaction pathway presented in Scheme 1, and that the same is true for N2 itself. Energetic considerations,12 in combination with the strong influence of α-70Val substitutions of MoFe protein without modification of FeMo-co reactivity then implicate Fe, rather than Mo, as the site of binding and reactivity.19
Supplementary Material
Acknowledgments
This work has been supported by the NIH (HL 13531, BMH; GM 59087, DRD and LCS; GM 62954, SAD) and NSF (MCB 0723330, BMH).
Footnotes
Supporting Information Available: two figures, one of X-band pulsed EPR spectra, and one of Q-band 1H ENDOR spectra; discussions of 1D 1H Four-pulse ESEEM and of 1H and 15N HYSCORE analysis, three figures. This material is available free of charge via the Internet at http://pubs.acs.org.
Citations
- 1.Smil V. Enriching the Earth: Fritz Haber, Carl Bosch, and the Transformation of World Food Production. MIT Press; Cambridge, MA: 2001. [Google Scholar]
- 2.Christiansen J, Dean DR, Seefeldt LC. Annu Rev Plant Physiol Plant Mol Biol. 2001;52:269–295. doi: 10.1146/annurev.arplant.52.1.269. [DOI] [PubMed] [Google Scholar]
- 3.Burgess BK, Lowe DJ. Chem Rev(Washington, DC, U S) 1996;96:2983–3011. doi: 10.1021/cr950055x. [DOI] [PubMed] [Google Scholar]
- 4.Eady RR. Chem Rev (Washington, D C) 1996;96:3013–3030. doi: 10.1021/cr950057h. [DOI] [PubMed] [Google Scholar]
- 5.Seefeldt LC, Hoffman BM, Dean DR. Annu Rev Biochem. 2009;78:701–722. doi: 10.1146/annurev.biochem.78.070907.103812. [DOI] [PMC free article] [PubMed] [Google Scholar]
- 6.Hoffman BM, Dean DR, Seefeldt LC. Acc Chem Res. 2009;42:609–619. doi: 10.1021/ar8002128. [DOI] [PMC free article] [PubMed] [Google Scholar]
- 7.Chatt J, Dilworth JR, Richards RL. Chem Rev. 1978;78:589–625. [Google Scholar]
- 8.Thorneley RNF, Eady RR, Lowe DJ. Nature. 1978;272:557–558. [Google Scholar]
- 9.Thorneley RNF, Lowe DJ. In: Molybdenum Enzymes. Spiro TG, editor. Vol. 7. Wiley-Interscience; New York: 1985. pp. 89–116. [Google Scholar]
- 10.Wilson PE, Nyborg AC, Watt GD. Biophys Chem. 2001;91:281–304. doi: 10.1016/s0301-4622(01)00182-x. [DOI] [PubMed] [Google Scholar]
- 11.Schrock RR. Acc Chem Res. 2005;38:955–962. doi: 10.1021/ar0501121. [DOI] [PMC free article] [PubMed] [Google Scholar]
- 12.Neese F. Angew Chem, Int Ed. 2006;45:196–199. doi: 10.1002/anie.200502667. [DOI] [PubMed] [Google Scholar]
- 13.Kastner J, Blochl Peter EJ. Am Chem Soc. 2007;129:2998–3006. doi: 10.1021/ja068618h. [DOI] [PubMed] [Google Scholar]
- 14.Hinnemann B, Norskov JK. Top Catal. 2006;37:55–70. [Google Scholar]
- 15.Burgess BK, Spiro TG, editors. John Wiley and Sons. New York: 1985. pp. 161–220. [Google Scholar]
- 16.Barney BM, Lukoyanov D, Igarashi RY, Laryukhin M, Yang TC, Dean DR, Hoffman BM, Seefeldt LC. Biochemistry. 2009;48:9094–9102. doi: 10.1021/bi901092z. [DOI] [PMC free article] [PubMed] [Google Scholar]
- 17.Barney BM, McClead J, Lukoyanov D, Laryukhin M, Yang TC, Hoffman BM, Dean DR, Seefeldt LC. Biochemistry. 2007;46:6784–6794. doi: 10.1021/bi062294s. [DOI] [PMC free article] [PubMed] [Google Scholar]
- 18.Lee H-I, Igarashi RY, Laryukhin M, Doan PE, Dos Santos PC, Dean DR, Seefeldt LC, Hoffman BMJ. Am Chem Soc. 2004;126:9563–9569. doi: 10.1021/ja048714n. [DOI] [PubMed] [Google Scholar]
- 19.Igarashi RY, Laryukhin M, Santos PCD, Lee HI, Dean DR, Seefeldt LC, Hoffman BMJ. Am Chem Soc. 2005;127:6231–6241. doi: 10.1021/ja043596p. [DOI] [PubMed] [Google Scholar]
- 20.Barney BM, Igarashi RY, Dos Santos PC, Dean DR, Seefeldt LC. J Biol Chem. 2004;279:53621–53624. doi: 10.1074/jbc.M410247200. [DOI] [PubMed] [Google Scholar]
- 21.Barney BM, Laryukhin M, Igarashi RY, Lee HI, Santos PCD, Yang TC, Hoffman BM, Dean DR, Seefeldt LC. Biochemistry. 2005;44:8030–8037. doi: 10.1021/bi0504409. [DOI] [PubMed] [Google Scholar]
- 22.Barney BM, Yang TC, Igarashi RY, Santos PCD, Laryukhin M, Lee HI, Hoffman BM, Dean DR, Seefeldt LC. J Am Chem Soc. 2005;127:14960–14961. doi: 10.1021/ja0539342. [DOI] [PubMed] [Google Scholar]
- 23.Barney BM, Lukoyanov D, Yang TC, Dean DR, Hoffman BM, Seefeldt LC. Proc Natl Acad Sci U S A. 2006;103:17113–17118. doi: 10.1073/pnas.0602130103. [DOI] [PMC free article] [PubMed] [Google Scholar]
- 24.Seefeldt LC, Dean DR, Hoffman BM, Dos Santos PC, Barney BM, Lee H-I. Dalton Trans. 2006:2277–2284. doi: 10.1039/b517633f. [DOI] [PubMed] [Google Scholar]
- 25.Kim CH, Newton WE, Dean DR. Biochemistry. 1995;34:2798–2808. doi: 10.1021/bi00009a008. [DOI] [PubMed] [Google Scholar]
- 26.Lowe DJ. ENDOR and EPR of Metalloproteins. R. G. Landes Co; Austin, TX: 1995. [Google Scholar]
- 27.Hoffman BM. Acc Chem Res. 2003;36:522–529. doi: 10.1021/ar0202565. [DOI] [PubMed] [Google Scholar]
- 28.Schweiger A, Jeschke G. Principles of Pulse Electron Paramagnetic Resonance. Oxford University Press; Oxford, UK: 2001. [Google Scholar]
- 29.DeRose VJ, Hoffman BM. In: Methods Enzymol. Sauer K, editor. Vol. 246. Academic Press; New York: 1995. pp. 554–589. [DOI] [PubMed] [Google Scholar]
- 30.Doan PE, Hoffman BM. Chem Phys Lett. 1997;269:208–214. [Google Scholar]
- 31.Hoefer P, Grupp A, Nebenfuehr H, Mehring M. Chem Phys Lett. 1986;132:279–282.
- 32.Dikanov SA, Bowman MKJ. Magn Res Ser A. 1995;116:125–128. [Google Scholar]
- 33.Dikanov SA, Bowman MKJBIC. J Biol Inorg Chem. 1998;3:18–29. [Google Scholar]
- 34.Jin H, Turner IM, Jr, Nelson MJ, Gurbiel RJ, Doan PE, Hoffman BM. J Am Chem Soc. 1993;115:5290–5291. [Google Scholar]
- 35.Dikanov SA, Tsvetkov YD, Bowman MK, Astashkin AV. Chem Phys Lett. 1982;90:149–153. [Google Scholar]
- 36.Dikanov SA, Samoilova RI, Kappl R, Crofts AR, Huttermann J. Phys Chem Chem Phys. 2009;11:6807–6819. doi: 10.1039/b904597j. [DOI] [PMC free article] [PubMed] [Google Scholar]
- 37.Sakamoto H, Higashimoto Y, Hayashi S, Sugishima M, Fukuyama K, Palmer G, Noguchi MJ. Inorg Biochem. 2004;98:1223–1228. doi: 10.1016/j.jinorgbio.2004.02.028. [DOI] [PubMed] [Google Scholar]
- 38.Wikipedia-Contributors Wikipedia. The Free Encyclopedia; [accessed 16 March 2011]. Occam’s razor. http://en.wikipedia.org/w/index.php?title=Occam%27s_razor&oldid=418788633. [Google Scholar]
- 39.Dilworth MJ, Eady RR. Biochem J. 1991;277:465–468. doi: 10.1042/bj2770465. [DOI] [PMC free article] [PubMed] [Google Scholar]
- 40.Benton PMC, Mayer SM, Shao J, Hoffman BM, Dean DR, Seefeldt LC. Biochemistry. 2001;40:13816–13825. doi: 10.1021/bi011571m. [DOI] [PubMed] [Google Scholar]
- 41.Lukoyanov D, Barney BM, Dean DR, Seefeldt LC, Hoffman BM. Proc Natl Acad Sci U S A. 2007;104:1451–1455. doi: 10.1073/pnas.0610975104. [DOI] [PMC free article] [PubMed] [Google Scholar]
Associated Data
This section collects any data citations, data availability statements, or supplementary materials included in this article.


