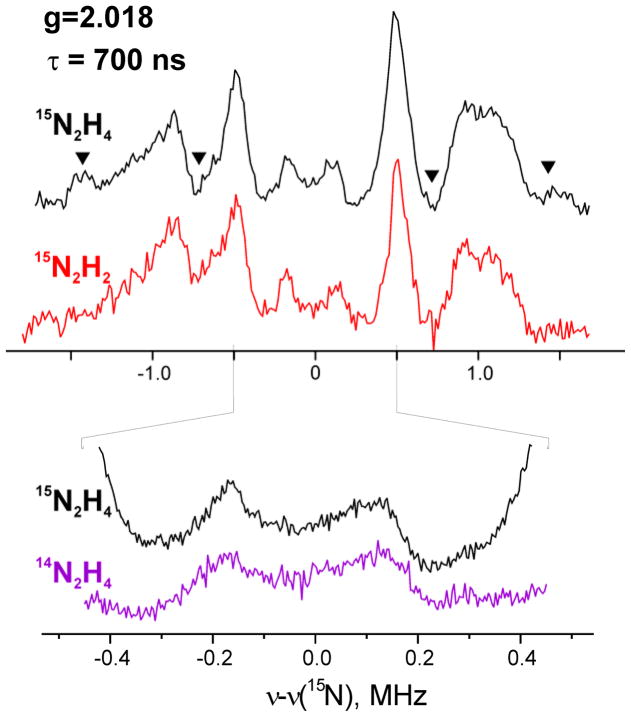
Figure 6.
35 GHz Mims 15N ENDOR spectra detected at the maximum of EPR signal intensity (g2 = 2.018) for l(15N2H4) (black) and m(15N2H2) (red) intermediates. Expanded spectra, below, compare region around 15N Larmor frequency for l(15N2H4) (black) and l(14N2H4) (purple) Spectra are shown after simple baseline correction; triangles represent distortions induced by “blind spots” of Mims ENDOR. Conditions: microwave frequency, ~ 34.82 GHz; Mims sequence, π/2 = 50 ns, τ = 700 ns; RF 40 μs; repetition time, 10 ms; 800–3800 scans; temperature, 2 K.

