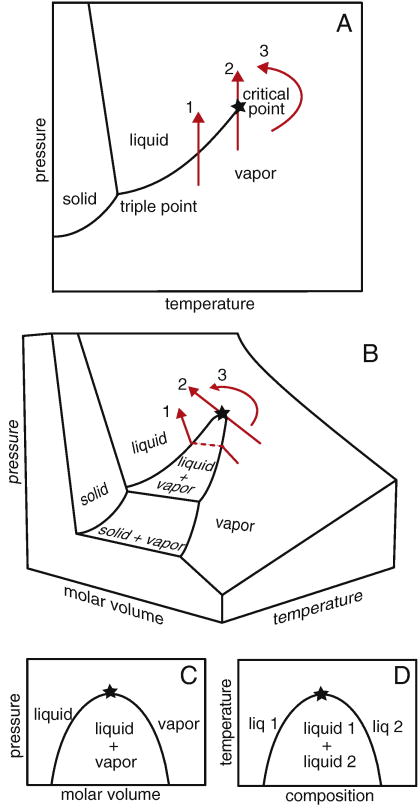
Figure 1.
(A) Phase diagram for water in the pressure-temperature plane. Path 1 crosses a coexistence line at which the vapor becomes a liquid. Along path 2, the same transition occurs at a critical point, which is marked with a star. Path 3 follows a continuous change from vapor to liquid without crossing the coexistence line. (B) The same paths are shown on a 3-dimensional phase diagram. (C) When molar volume is considered, there is a region of vapor and liquid coexistence, rather than merely a line. This region ends in a critical point. (D) The same type of phase diagram describes miscibility of two liquids, where the critical point is an upper consolute point.

