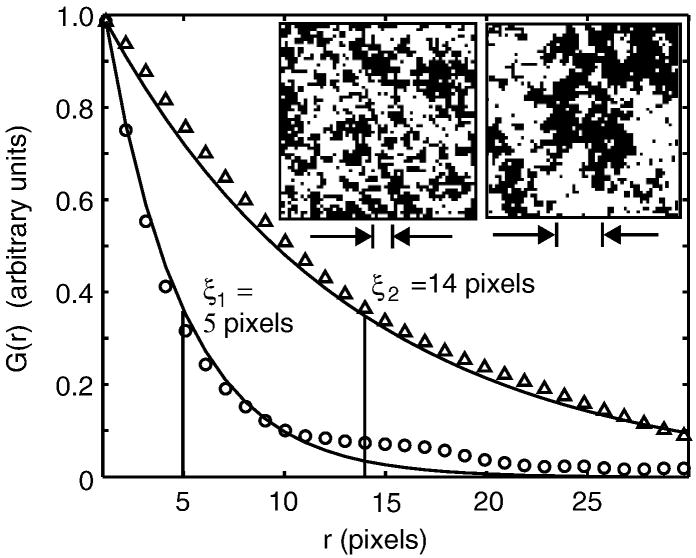
Figure 3.
Insets show Ising model simulations conducted far above the critical temperature (left) and just above the critical temperature (right). The interaction parameter, J, has a value of 0.035kBT and 0.0425kBT, respectively. The graph shows angular-averaged autocorrelation functions G(r) vs. distance r, derived from the simulation images, where data from the left inset are plotted as circles, and data from the right as triangles. Correlation length, ξ, is defined by fitting to G(r) ∝ e−r/ξ, as shown by the solid line. The fit is conducted over the entire range of r in the simulation, but only shown for r < 30. The correlation length for each simulation is indicated by the distance between the arrows below each image. The high-temperature simulation has a correlation length of about 4 pixels (or lattice spacings). In contrast, the autocorrelation function for the system near a critical point decays more slowly, with a larger correlation length of ~14 pixels, reflecting the presence of long-distance correlations between points.

