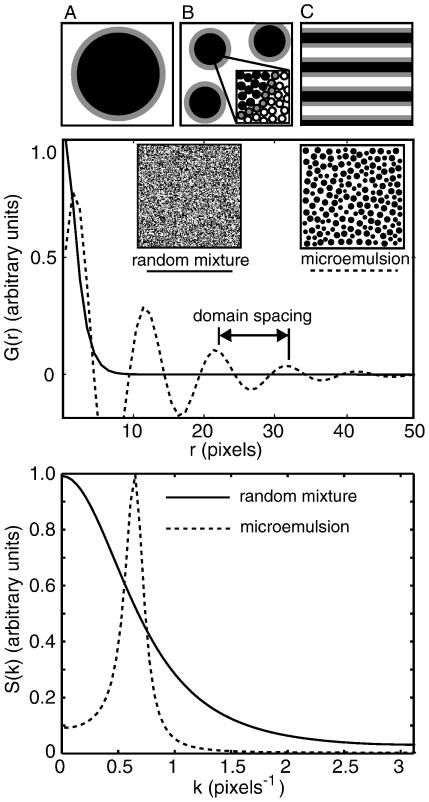
Figure 7.
Top: Sketches of an emulsion (A), microemulsion (B), and lamellar phase (C) in which grey surfactant molecules line the boundary between the white and black phases. Middle: Autocorrelation functions G(r) for a disordered fluid (solid line) and a microemulsion (dashed line) are plotted vs. distance r from the functional forms given in reference (42). The insets are illustrative sketches. Bottom: Structure factors S(k) are obtained by transforming the autocorrelation functions shown in the middle panel.

