
Figure 10.
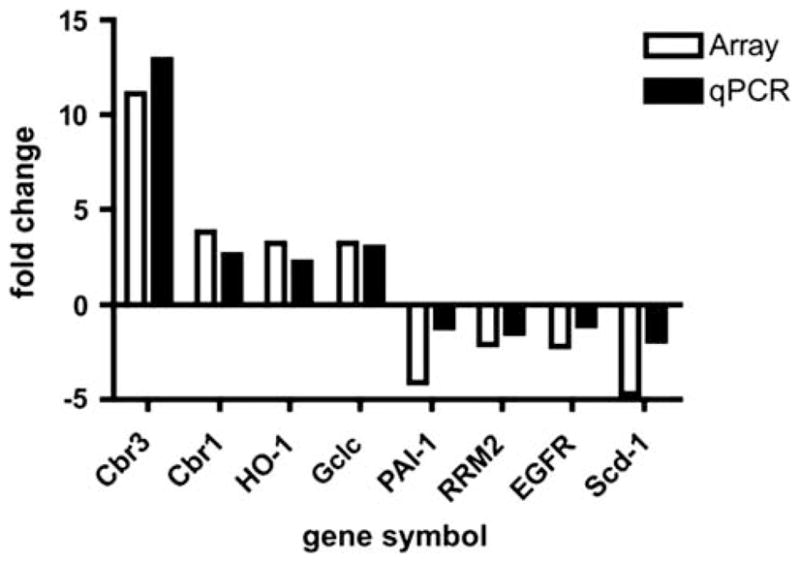
Correlation of gene expression data obtained by cDNA microarray and qPCR. Differences in gene expression between wt and gclm null liver RNA from analyses by cDNA microarray (expressed as fold changes) and qPCR (expressed as ΔΔCt). (r2) = 0.913. Gene symbols: Cbr3 (carbonyl reductase 3), Cbr1 (carbonyl reductase 1), HO-1 (heme oxygenase 1), gclc (glutamate-cysteine ligase, catalytic subunit), PAI-1 ( plasminogen activator inhibitor 1), RRM2 (ribonucleotide reductase M2), EGFR (epidermal growth factor receptor), scd1 (stearoyl-Co enzyme A desatuase-1).