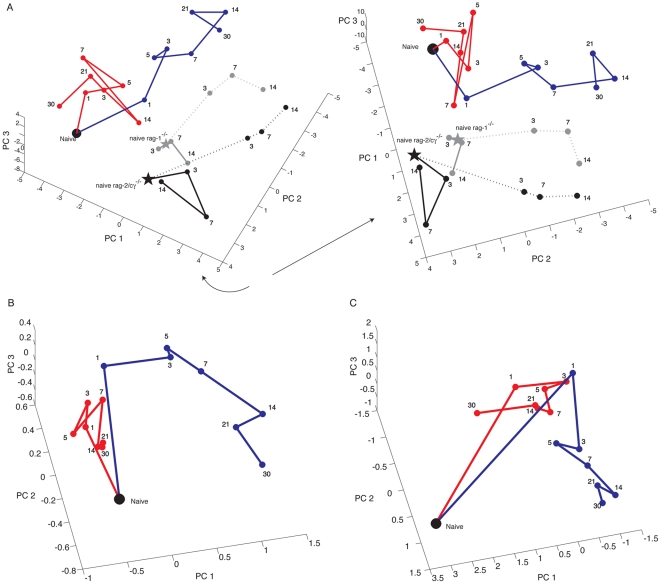
Figure 3. Distinct patterns of miR expression based on PCA are lymphocyte independent and can be detected using a limited set of miRs.
Panel A, three-dimensional plot of the first three PCs for C57BL/6 mice undergoing either a sham procedure (red line), or IRI (blue line), Rag-1−/− mice undergoing either a sham procedure (solid grey line) or IRI (dotted grey line), or Rag-2/γc−/− mice undergoing either a sham procedure (solid black line) or IRI (dotted black line). Samples for naïve C57BL/6 mice are show as a black dot. Samples for naïve Rag-1−/− and or Rag-2/cγ−/− mice are shown as grey and black stars, respectively. Right panel, shown is the plot to the left rotated clockwise in order to highlight differences in PC1 between samples (Movie S2). Panel B, PCA of nine differentially expressed miRs. Shown is a three-dimensional plot of the first three PCs obtained by performing PCA on expression data for miR-21, miR-20a, miR-146a, miR-199a-3p, miR-214, miR-192, miR-187, miR-805 and miR-194 obtained for kidneys from C57BL/6 mice following IRI (blue line) or sham surgery (red lines) (Movie S3). Panel C, Shown is a three-dimensional plot of the first three PCs obtained by performing PCA on all expression data obtained for kidneys from C57BL/6 mice following IRI (blue line) or sham surgery (red lines) in which we eliminated miR-21, miR-20a, miR-146a, miR-199a-3p, miR-214, miR-192, miR-187, miR-805 and miR-194 from the analysis. Samples for naïve C57BL/6 mice are show as a black dot with a red center. Numbers shown represent the time point analyzed in days. (Movie S4).

