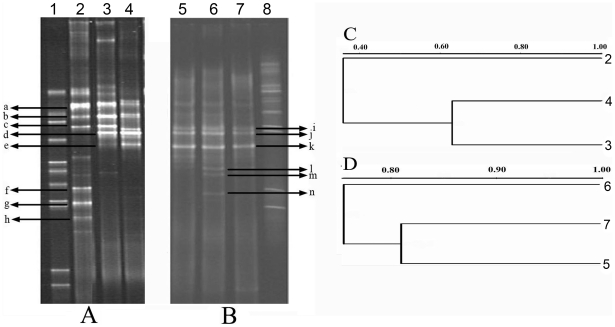
Figure 1. DGGE fingerprints of microbial communities of three samples.
(A) Bacterial 16S rRNA gene V3 region PCR-DGGE profiles of injection and production waters. (B) Archaeal 16S rRNA gene V3 region PCR-DGGE profiles of injection water and production waters. (C) Clustering dendrogram of bacterial DGGE profiles. (D) Clustering dendrogram of archaeal DGGE profiles. 1, bacterial DGGE marker; 2 and 5, sample W; 3 and 7, sample C; 4 and 6, sample L; 8, archaeal DGGE marker.

