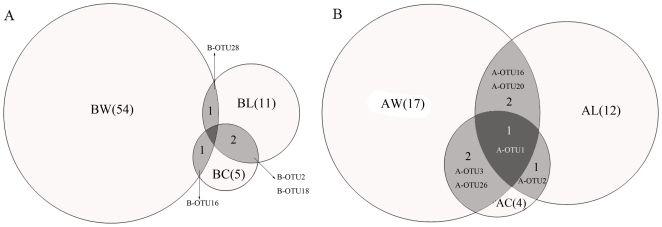
Figure 4. Venn diagram showing the distribution of OTUs.
(A) Bacterial OTUs. (B) Archaeal OTUs. BW and AW, sample W; BC and AC, sample C; BL and AL, sample L. The number of OTUs in each sample is in parentheses. The number and name of OTUs shared by different samples are showed in the shaded part of the circles.

