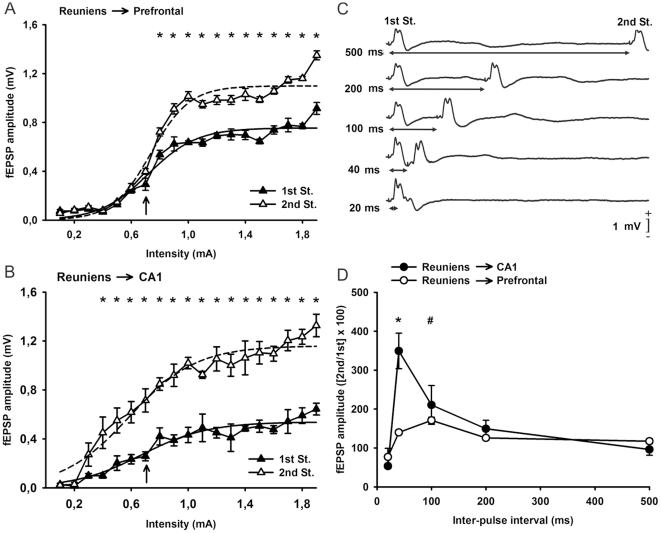
Figure 2. Input/output curves and paired-pulse stimulation of the reuniens-mPFC and reuniens-CA1 synapses using paired-pulse stimulation.
(A) Relationships between the intensity (in mA) of pairs of stimuli (40 ms of interstimulus interval) presented to the reuniens nucleus and the amplitude of the fEPSPs evoked in the mPFC by the 1st (black triangles) and the 2nd (white triangles) pulses. Data are represented as mean ± s.e.m. *, P<0.01 for differences in the amplitude of fEPSPs evoked by the two pulses. The best three-parameter sigmoidal fits to the two set of data are included (1st pulses, continuous line: y = 0.75/(1+exp[−(x-0.71)/0.16]); r = 0.97; P<0.001; 2nd pulses, dashed line: y = 1.09/(1+exp[−(x-0.73)/0.13]); r = 0.98; P<0.001). *, P<0.01. (B) The same as for A, but representing data collected from the reuniens-CA1 synapse. *P<0.01 for differences between fEPSPs evoked by the two pulses. Sigmoidal fits to the two set of data are also included (1st pulses, continuous line: y = 0.53/(1+exp[−(x-0.67)/0.23]); r = 0.96; P<0.001; 2nd pulses, dashed line: y = 1.16/(1+exp[−(x-0.58)/0.23]); r = 0.97; P<0.001). *, P<0.01. (C) Representative records (average of three traces) of fEPSPs evoked at the reuniens-mPFC synapse by paired-pulse stimulation at five different (20, 40, 100, 200, and 500 ms) interpulse intervals. Stimulus intensity was 0.7 mA, i.e., ≈50% of the asymptotic value for this synapse (see arrow in A). (D) Paired-pulse depression and facilitation of fEPSPs recorded from the reuniens-mPFC (white circles) and the reuniens-CA1 (black circles) synapses. The pairs of pulses were set at 0.7 mA (see arrows in A and B). The data shown are mean ± s.e.m. amplitudes of the 2nd fEPSP expressed as a percentage of the 1st [(2nd/1st) ×100] for the five interstimulus intervals used in this study. Note that peak facilitation was at 40 ms of interval for the reuniens-CA1 synapse and at 100 ms for the reuniens-mPFC synapse. *, statistical differences for reuniens-CA1 synaptic facilitation at 40 ms of interval, with respect to the 500 ms one; #, statistical differences for reuniens-mPFC synaptic facilitation at 100 ms interval, with respect to both the 20 and 500 ms ones, P<0.05. Tukey's post-hoc comparison test.

