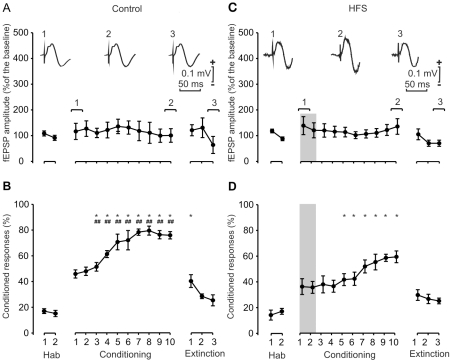
Figure 4. Learning curves and evolution of synaptic field potentials evoked in the CA1 area by the electrical stimulation of the reuniens nucleus for controls (A, B) and following two HFS sessions (C, D).
(A) Evolution of fEPSPs evoked at the reuniens-CA1 synapse across the successive habituation, conditioning, and extinction sessions. At the top are illustrated selected fEPSPs recorded in the CA1 area during the indicated sessions, following a single pulse presented to the reuniens nucleus. Note that no significant change in fEPSP amplitude was observed across conditioning. Calibrations as indicated. (B) Evolution of the percentage (%) of conditioned responses during the successive sessions. Mean % values are followed by ± s.e.m. (C) Evolution of fEPSPs evoked at the reuniens-CA1 synapse across training, following two HFS sessions presented 30 min before the first two conditioning sessions. Note that these HFS sessions did not evoke any noticeable LTP in fEPSPs recorded in the CA1 area. (D) Evolution of the percentage (%) of conditioned responses during the successive sessions following the two HFS sessions. Note the small increase in the percentage of conditioned responses. *, P<0.001, significant differences with respect to habituation values for B and D. #, P<0.05; ##, P<0.01, significant differences between the percentage of conditioned responses achieved without (B) or following two HFS sessions (D).

