Fig. 5.
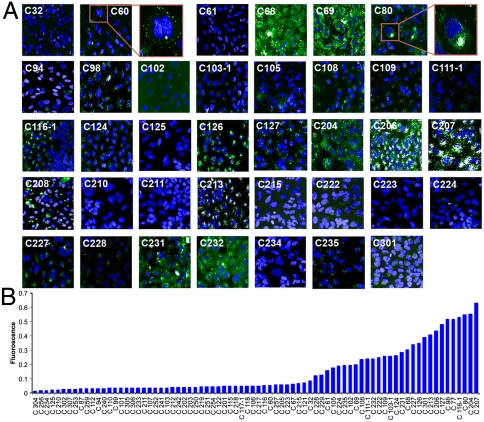
In vitro uptake screening. (A) Cellular internalization of selected nanoparticles after 1 hr of incubation is demonstrated by HT automated confocal microscopy. HeLa cells were exposed to all C-based nanoparticles complexed with Alexa-594 siRNA (50∶1, wt/wt). Twenty different fields were imaged and a representative image of nanoparticle/siRNA complex is presented (Alexa 594 is pseudocolored green). Additional images appear in Fig. S4. (B) The total fluorescence was quantified and plotted. False positives were identified by visible aggregation (e.g., C208 included for reference) or significant background and were removed from the graph. Interestingly, C60 nanoparticles interact with the cell membrane but did not enter cells, while C80 nanoparticles were effectively internalized (see zoom insets).

