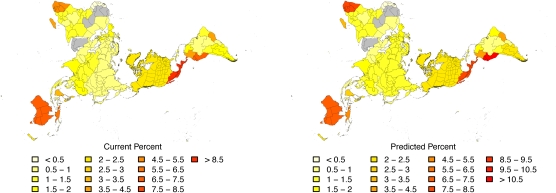
Fig. 2.
Currently known patterns of flowering plant species richness as a percent of all species (Left) and patterns when corrected for species predicted to be missing from the taxonomic record (Right). They are broadly similar; differences are noted in the text. Although our results do not take area into account, we plot the results in an equal-area projection to help visualize the sometimes confusing relationship between undiscovered species and region. We excluded gray regions (Saharan Africa and the Arabian Peninsula) from the analysis as a result of low numbers of endemic species. Original TDWG regions are shown in Fig. S1. Fig. S3 shows raw estimates of numbers of missing species in each region.

