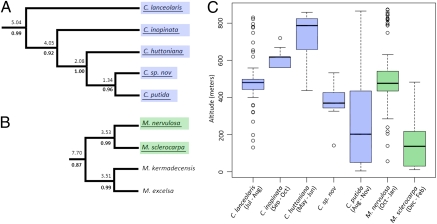
Fig. 3.
Ecological divergence in Coprosma and Metrosideros. (A and B) Phylogenetic subtrees with endemic LHI species underlined (full trees are shown in SI Appendix, Figs. S14 and S26). Numbers above branches are the upper 95% CI for the node ages. Numbers below branches are posterior probabilities. (C) Box plot depicting altitudinal distributions, showing the median (in bold type), interquartile range (box), and 1.5 times the interquartile range (bars); circles represent outliers (C. lanceolaris, n = 101; C. inopinata, n = 33; C. huttoniana, n = 46; C. sp. nov., n = 16; C. putida, n = 159; M. nervulosa, n = 99; M. sclerocarpa, n = 78). Flowering periods for each species are given in brackets.

