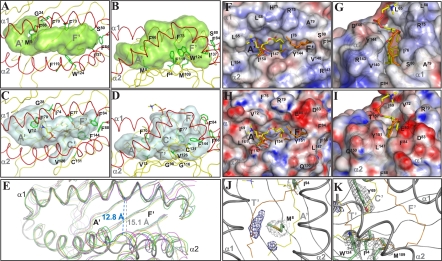
Fig. 1.
Structure of the scCD1e α1–α2 superdomain showing the groove architecture. Top (A) and side (B) views of the α1–α2 domain of scCD1e, with the transparent molecular surface of the groove rendered in light green. (C and D) Similar views of the human CD1b groove (2H26, gray surface). (A–D) The protein backbones are colored in yellow with the exception of the α-helical portions (red). PC associated with CD1b is shown as sticks with the carbon atoms in yellow, oxygens in red, nitrogens in blue, and phosphates in orange. All UL atoms are colored in orange. Side-chain atoms of residues differing among CD1 isoforms and/or causing notable changes in scCD1e groove architecture are shown as green sticks, with the corresponding Cα atoms depicted as balls. (E) Aperture of the CD1e groove portal. Comparison of the α1–α2 domain of scCD1e (thick gray tubes) with those of human CD1a (yellow, 1ONQ), CD1b (blue, 2H26), CD1c (magenta, 3OV6), and CD1d (green, 1ZT4). The image was generated by superimposition of residues 57–79 of the α1 helix and residues 93–101 of the β-sheet platform of scCD1e on the corresponding residues of the other human CD1 molecules. The distance between the Cα atoms of Phe73 and Tyr144 of scCD1e is compared with the distance between the corresponding Phe77 and Tyr151 of CD1b. (F–I) Comparison of the groove portals of scCD1e (F and G) and human CD1b (H and I). The molecular surfaces are presented with electrostatic potentials calculated at neutral pH (red, electronegative; blue, electropositive; −30 to +30 kT/e) in the top (F and H) and front views (G and I). PC and UL ligands are shown as sticks with atoms colored as in C and D. The position of the CD1b-bound ligands is shown for comparison in F and G after superimposition on the scCD1e structure. (J–K) Weak electron density from ligands in the scCD1e lipid-binding groove. The final FoFc map was contoured at 3.0σ (blue mesh) around the position of atoms of groove-bound ligands from superimposed CD1 structures (PC and UL of human CD1b, αGalCer of human CD1d, SLF of human CD1a, and mannosyl-β1-phosphomycoketide (MPM) and C12 of human CD1c). For ease of comparison, only the CD1b ligands are shown with lines colored as noted above. The electron densities (2FoFc, contoured at 1.0 σ) around the side-chain atoms of Met8 and Ile94 (J) or Tyr69, Ile94, Met109, and Trp124 (K) are also shown in gray. The positions of the A′, C′, F′, and T′ pockets/tunnel of human CD1b are indicated for comparison.

