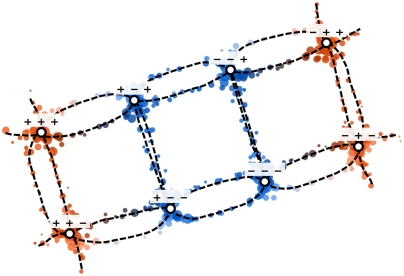
Fig. 3.
A 2D, sketch-map projection of the landmark points selected from the dataset depicted in Fig. 2. This model has eight minima in the free-energy surface, which appear at (± π/2, ± π/2, ± π/2). Projections of these points are indicated on this figure using labeled circles, while the various transition pathways are shown as dashed lines. Parameters for the sigmoid functions were chosen based on the histogram of distances (Fig. 2D) as σ = 2, aD = 3, bD = 9, ad = 2, and bd = 2. Projected points are colored, using the key shown in Fig. 2C, in accordance with the value of one of the three underlying variables.

