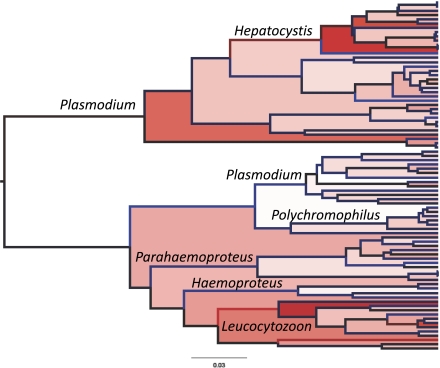
Fig. 3.
Phylogenetic tree produced using a relaxed clock with an HKY + gamma model of nucleotide substitution and uncorrelated, lognormally distributed rates. Relative rates of evolution on branches increase from blue through black to red, and also increase as shown by fills from white to red. High rates of nucleotide substitution particularly characterize mammalian Hepatocystis and avian Leucocytozoon; also see Fig. 4.

