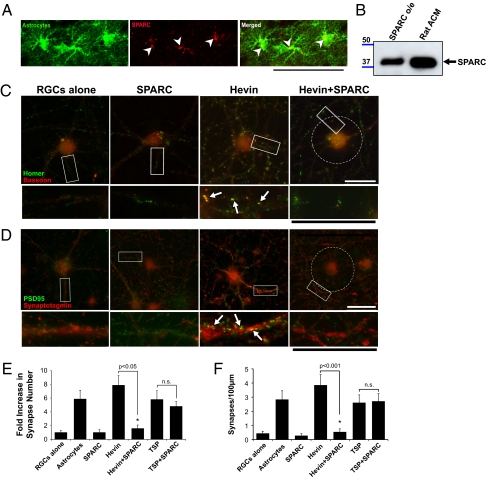
Fig. 4.
SPARC antagonizes the synaptogenic activity of hevin. (A) A sagittal brain section from a P19 Aldh1-L1–EGFP transgenic mouse that expresses GFP (green) in protoplasmic astrocytes throughout the CNS was stained with goat anti-SPARC antibody (R&D Systems). SPARC staining (red) colocalizes (arrowheads) with the GFP expressing astrocytes (green). (Scale bar: 50 μm.) (B) Western blot analysis of rat ACM shows a 43-kDa band corresponding to SPARC protein (black arrow). SPARC o/e, HEK293 cell culture supernatant from cells expressing SPARC. (C and D) Representative images of RGCs that were cultured alone or treated with SPARC (100 nM), hevin (30 nM), or both (30 nM hevin, 100 nM SPARC) and stained with antibodies against presynaptic [red; (C) bassoon or (D) synaptotagmin] and postsynaptic [green; (C) homer or (D) PSD95] markers. RGCs cultured alone or treated with SPARC (100 nM) did not have many colocalized synaptic puncta, whereas hevin induced formation of synapses (white arrows). Addition of hevin and SPARC at the same time led to the complete loss of the synaptogenic activity of hevin (Right), although pre- and postsynaptic clusters were still visible (see lower panels). In this condition, presynaptic synaptotagmin clusters were excluded from the cell body and proximal dendrites (white circle). (Scale bars: 30 μm.) Quantification of the fold changes in colocalized synaptic puncta number per cell (E) and synaptic density (F) for RGCs cultured alone, with astrocyte feeder layers, hevin (30 nM), SPARC (100 nM), hevin plus SPARC (30 nM and 100 nM, respectively), TSP1 (8 nM), and TSP1 plus SPARC (8 nM and 100 nM, respectively). Fold increase is calculated based on the number of synapses formed by RGCs cultured alone (mean synapse number for RGCs alone condition, 0.933 ± 0.27; *P < 0.05; n = 20 cells per condition; n.s., not significant; error bars indicate SEM).

