Fig. 5.
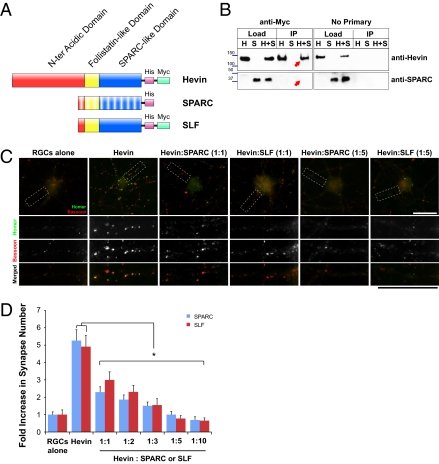
SPARC and C-terminal SLF of hevin antagonize hevin-induced synapse formation in a dose-dependent manner. (A) Schematic representation of domain structure of hevin, SPARC, and hevin truncation construct SLF. SPARC and hevin are composed of C-terminal SPARC-like (blue) and follistatin-like domains (yellow) and N-terminal acidic domains (red). SPARC and hevin are 60% identical at their C-terminal regions; however, they have low homology at the N terminus. The recombinant proteins used in this study contained tags (6-histidine tag and/or myc tag) for purification and immunoprecipitation. (B) Hevin does not interact with SPARC. Purified hevin was immunoprecipitated with an anti-myc tag antibody bound to Protein A/G beads (Pierce; Left). SPARC did not coimmunoprecipitate with hevin. Hevin was detected with goat anti-hevin polyclonal antibodies (Upper), and SPARC was detected with goat anti-SPARC polyclonal antibodies (R&D Systems; Lower). The experiment was repeated without anti-myc tag antibody (no primary; Right) as a negative control. H, purified hevin; S, purified SPARC; H+S, hevin and SPARC together. (C) Representative images of RGCs that were cultured alone or with hevin or with hevin plus SPARC or Hevin plus SLF (1:1 and 1:5 molar ratios), stained with the presynaptic marker bassoon (red) and the postsynaptic marker homer (green). Colocalized puncta in merged images represent synapses. (Scale bars: 30 μm.) (D) Quantification of the fold changes in colocalized synaptic puncta number per cell for RGCs cultured alone, with hevin (30 nM), and with hevin plus increasing concentrations of SPARC or SLF. Fold increase is calculated based on the number of synapses formed by RGCs cultured alone [mean synapse numbers for RGCs alone, 3.05 ± 0.48 (SPARC set) and 2.58 ± 0.70 (SLF set); *P < 0.05; n = 20 cells per condition; error bars indicate SEM).

