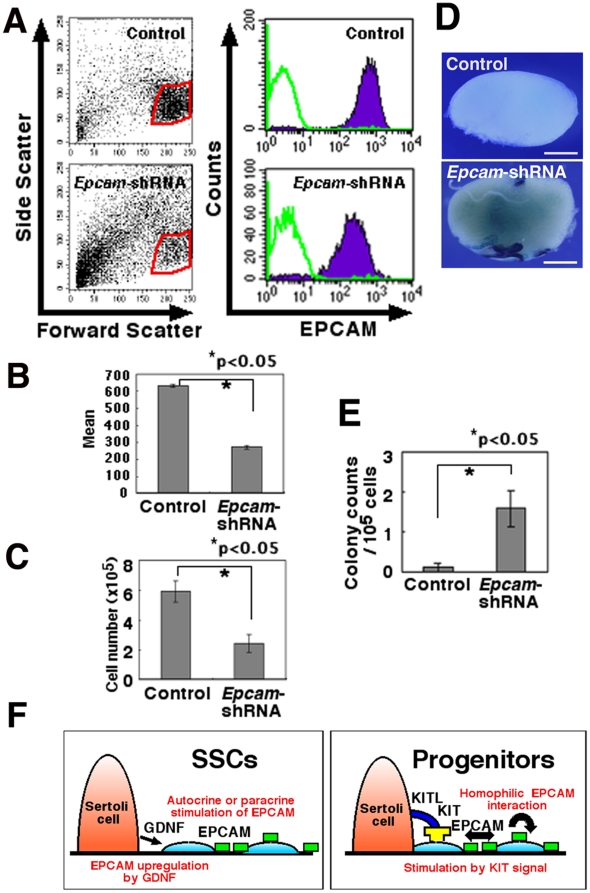
Figure 5. Epcam KD in ROSA GS cells by shRNA.
(A) Flow cytometric profile of ROSA GS cells 2 days after transduction with Epcam KD vector. Green lines indicate controls. (B) Expression of EPCAM represented by the mean fluorescence intensity. Data are expressed as mean fluorescence intensity minus background autofluorescence of cells stained with the control secondary antibody. (C) Reduced recovery of ROSA GS cells after transduction with shRNA against Epcam. GS cells (8×10⁵) on MEFs were infected with the lentivirus and recovered 2 days later. Results of three experiments are shown. (D) Macroscopic appearance of the recipient testes transplanted with Epcam KD GS cells. The same number of cells was transplanted at the same time. Blue tubules indicate germ cell colonies developed from donor SSCs. (E) Assessment of SSC activity by germ cell transplantation. ROSA GS cells were transplanted into the seminiferous tubules of W mice 3 days after transduction with shRNA against Epcam. (F) A model for EPCAM function during SSC differentiation. GDNF upregulates EPCAM expression on SSCs/progenitors. Proliferation/survival of progenitors may be stimulated by EPCAM expression on neighboring cells as well as by KITL on Sertoli cells. Stain: X-Gal (D). Bar = 1 mm (D).

