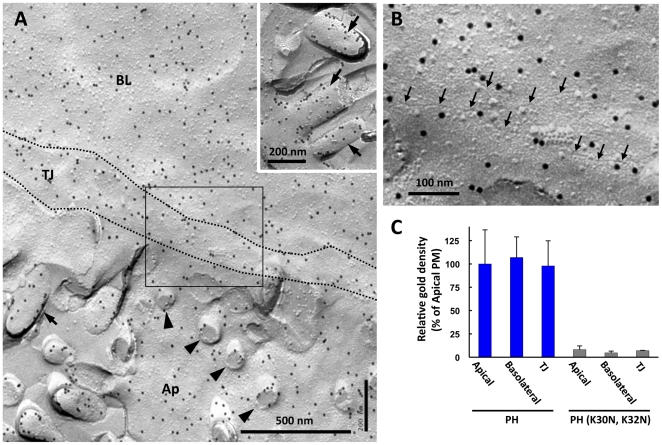
Figure 3. PI(4,5)P2 in the plasma membrane.
(A) PI(4,5)P2 was labeled in an equivalent density in the P face of the apical domain (Ap), the basolateral domain (BL), and the tight junctional region (TJ) of the plasma membrane. The tight junctional region is demarcated by dotted lines. In the apical membrane, most microvilli were fractured at the basal portion and seen as stubs (arrowheads), but some were fractured longitudinally (arrows; arrows in the inset). The labeling density in the microvillar membrane was not significantly different from that in the flat portion of the apical membrane. (B) A high magnification image of the tight junctional region (the area in the rectangle of Fig. 3A). The tight junction was observed as shallow grooves in the P face (arrows). Some PI(4,5)P2 labeling was observed near the groove, but the total density in the junctional region was not different from that of the apical and basolateral membrane domains. (C) Quantification of the relative labeling density in the P face (average ± standard error). The density of colloidal gold particles is shown as the relative ratio to that of the apical domain. The data were collected from three independent experiments, and the total measured areas were 4.6 µm2 (apical), 8.6 µm2 (basolateral), and 7.7 µm2 (tight junction). The labeling density was equivalent in the three regions. GST-PH (K30N, K32N) produced little labeling in all three domains.

