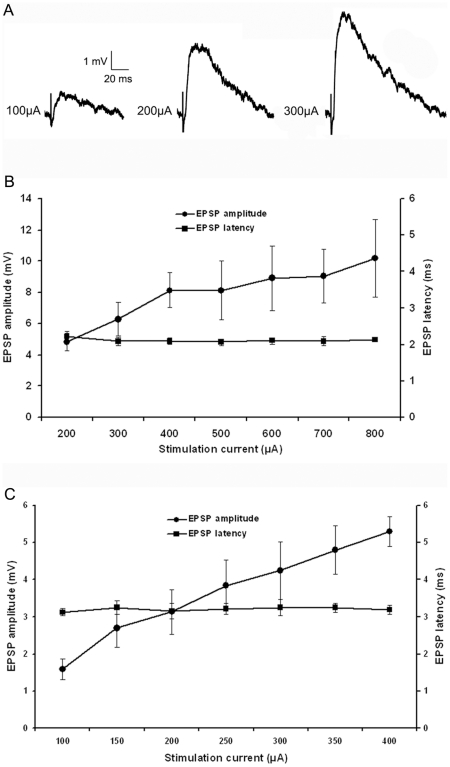
Figure 6. Two types of EPSPs.
A) With increasing stimulation intensity, tecto-pulvinar EPSPs in the Pd show a graded increase in amplitude. B) Average first type EPSP amplitudes and latencies as a function of stimulation intensity (n = 17), graph show a graded increase in peak amplitude correlate to the increase in stimulation current but the latency of the EPSP is not relative to stimulation current. C) Average second type EPSP amplitudes and latencies as a function of stimulation intensity (n = 8), second type EPSP show a graded increase in peak amplitude and no change in latency with increasing stimulation intensity, but the threshold amplitude was smaller and latency was longer (p<0.05).

