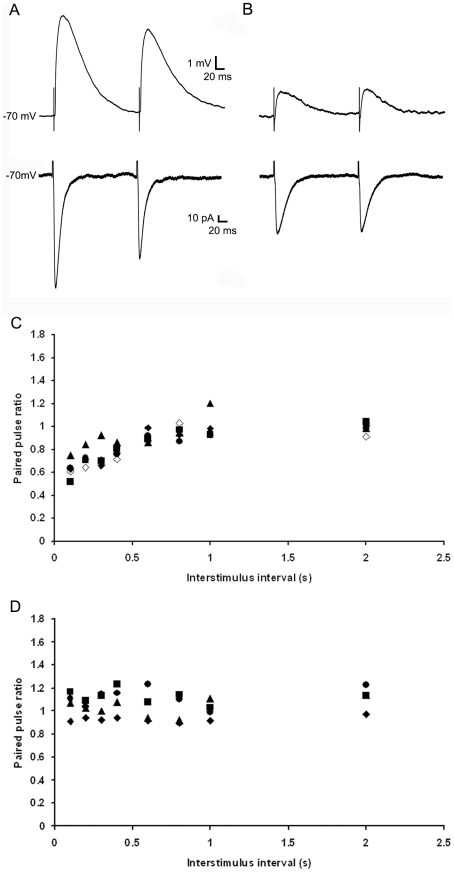
Figure 8. Two types of EPSPs display distinct short-term plasticity by paired-pulse stimulation.
A) 1st and 2nd EPSP evoked by paired pulse stimulation of first type tecto-pulvinar fiber at 200 ms time interval, traces were recorded at resting membrane potential at −58 mV (upper panel) or −70 mV under voltage-clamp mode (lower panel), both traces showed paired-pulse depression. B) 1st and 2nd EPSP evoked by paired pulse stimulation of second type tecto-pulvinar fiber at 200ms time interval, traces were recorded at resting membrane potential at -59mV (upper panel) or −70 mV under voltage-clamp mode (lower panel), both traces showed stable EPSP amplitudes. C) Plots of paired-pulse ratio (EPSP2 amplitude/EPSP1 amplitude) as a function of inter-stimulus intervals (0.1 s, 0.2 s, 0.3 s, 0.4 s, 0.6 s, 0.8 s, 1 s, 2 s) by stimulation of first type tecto-pulvinar fiber, showed gradual increase of paired-pulse ratio. D) Plots of paired-pulse ratio (EPSP2 amplitude/EPSP1 amplitude) as a function of inter-stimulus intervals (0.1 s, 0.2 s, 0.3 s, 0.4 s, 0.6 s, 0.8 s, 1 s, 2 s) by stimulation of second type tecto-pulvinar fiber, showed stable paired-pulse ratio.

