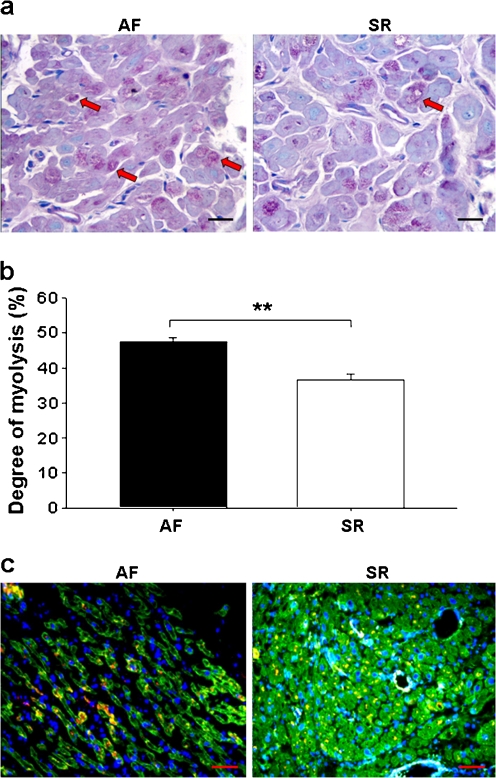
Fig. 3.
Myolysis in RAAs and localization of Hsp27 in atrial myofibrils. a Representative photomicrographs showing less loss of sarcomeres (blue staining) and accumulation of glycogen (red staining) in SR (red arrows, ×400, bar 20 μm). b The degree of myolysis, expressed as mean ± SEM; **p < 0.01. c Representative immunofluorescent photomicrographs of longitudinal (AF) and transverse (SR) sections showing myosin (green), Hsp27 (red), nuclei (DAPI, blue) and co-localization of Hsp27 with myosin (yellow) in RAAs (×200, bar 50 μm)

