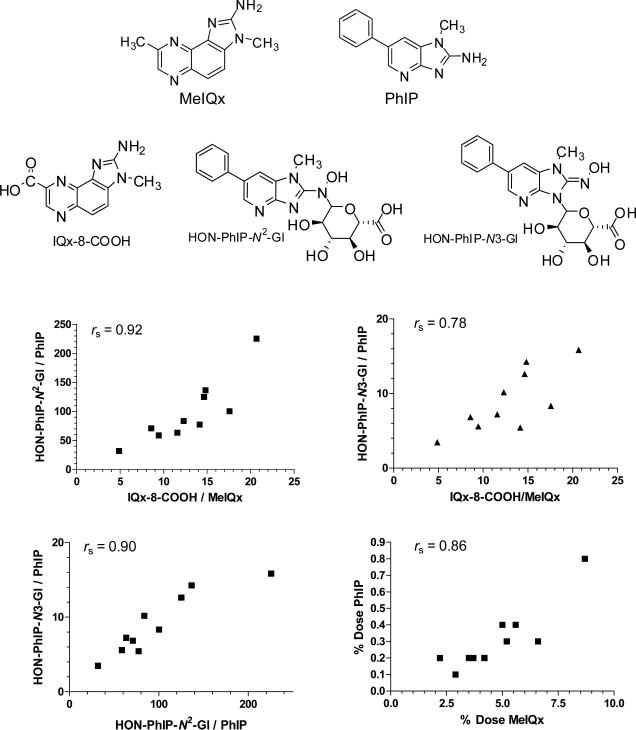
Figure 8.
Scatter plots relating the percentage of the unmetabolized dose of MeIQx and PhIP, and relating the MR of P450 1A2-oxidized MeIQx and PhIP metabolites (% of dose of metabolite/% of dose of unmetabolized MeIQx or PhIP) eliminated in urine collected for 10 h after meat consumption (103).

