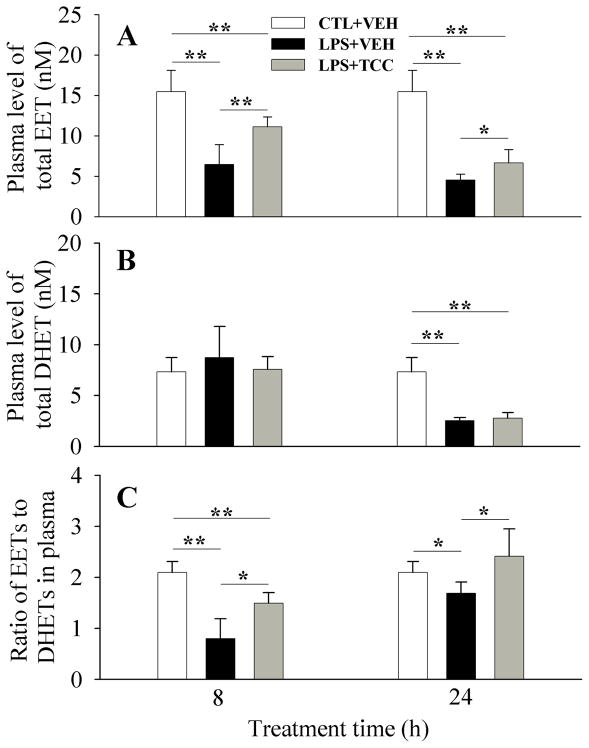
Figure 4.
Administration of TCC alters the plasma oxylipins levels of EETs (A) and DHETs (B) in vivo, resulting in an alteration in the ratio of EETs to DHETs (C). LPS and TCC were administered to male Swiss-Webster mice (8-week old) with ip injection and oral gavage, respectively. Data represent mean ± SD of 6 mice. The total EETs column sums 14, 15-, 11, 12-, 8, 9- and 5, 6-EETs and their corresponding diols compose the total DHETs column. Control (CTL) and vehicle (VEH) are the same as those in Figure 3. The full oxylipin data are presented in Table 2. Statistically significant differences (*P < 0.05, **P < 0.01) were determined by ANOVA followed with Tukey’s test.

