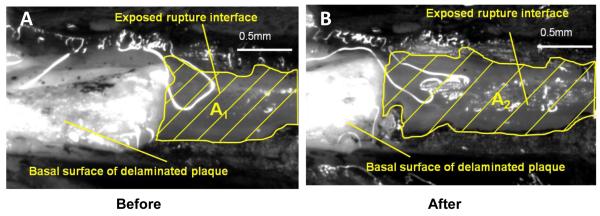
Figure 3. Top view of exposed rupture interface and basal surface of delaminated plaque before (A) and after (B) a loading-unloading cycle.
The black tissue marking dye clearly outlines the newly-exposed rupture surface (grey) A1 and A2 on the vascular wall. After a loading-unloading cycle, a segment of the plaque (white) was peeled off the vascular wall, so there is more rupture interface exposed in B than in A. Scale bar = 0.5 mm.

