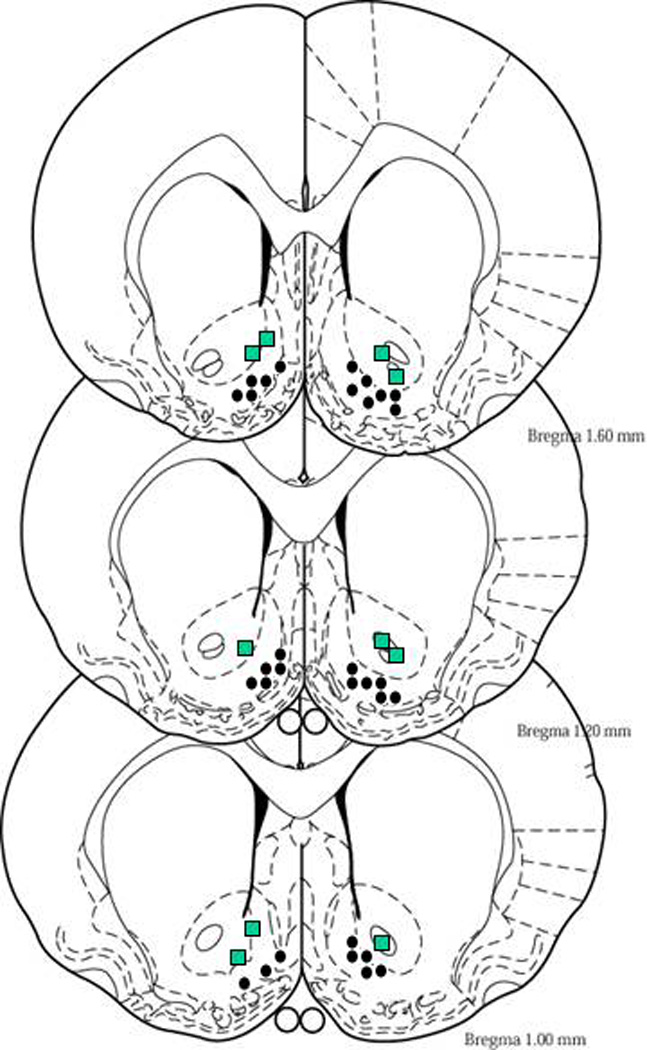
Figure 1.

Representative injection sites in the AcbSh and AcbC of P and Wistar rats (overlapping sites are excluded). Circles represent sites of injection within the AcbSh and squares represent sites of injection within the AcbC. For illustrative purposes, injection sites for P and Wistar rats are depicted on the left and right sides of the figures, respectively.
