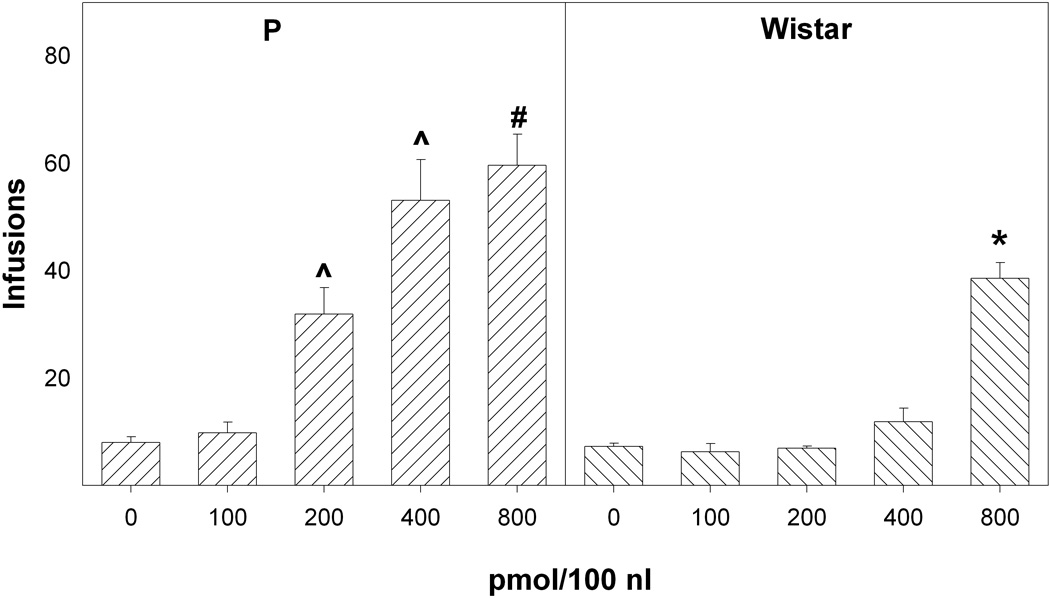
Figure 2.

The effects of the concentration of cocaine infused into the nucleus accumbens shell on the mean (± SEM) number of infusions received over the initial 4 sessions (acquisition) by P (left panel) and Wistar (right panel) rats. ^ indicates a significantly higher number of infusions than the 0 or 100 pmol/100 nl groups by P rats. # indicates significantly more infusions compared to the 200 pmol/100 nl group by P rats. * indicates significantly higher infusions compared to the 0, 100, 200 and 400 pmol/100 nl groups by Wistar rats. ^ also indicates significantly greater infusions by P rats compared to Wistar rats for the 200, 400 and 800 pmol/100 nl concentrations of cocaine.
