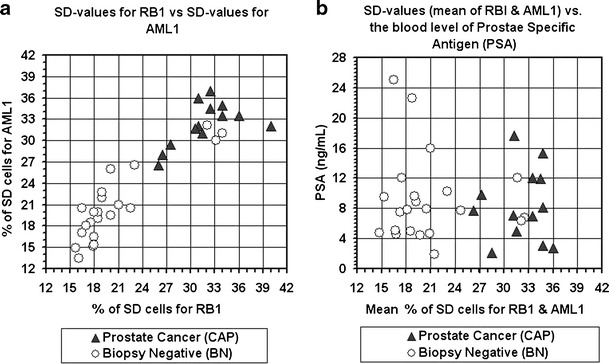
Fig. 2.

Distribution of blood samples according to their SD values (a) and SD vs. PSA values (b). CAP–samples of patients diagnosed cancer positive by the prostate biopsy examination; BN—sample of patients diagnosed cancer-negative by the prostate biopsy examination. Note the considerable high separation, between the two groups, attained by the SD values, and low separation achieved by the PSA blood levels
