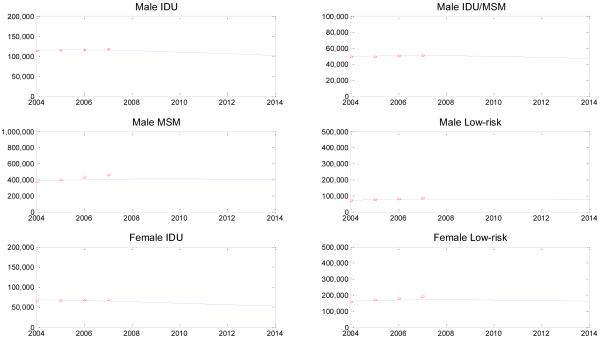
Figure A-3. Number of people living with HIV, 2004-2014.
The model’s projections are shown by the solid line, and CDC estimates from 2004 to 2007 are shown by the red asterisks. The CDC estimates are calculated based on the total number of people living with HIV and the percent of cases due to each transmission mode.[17]

