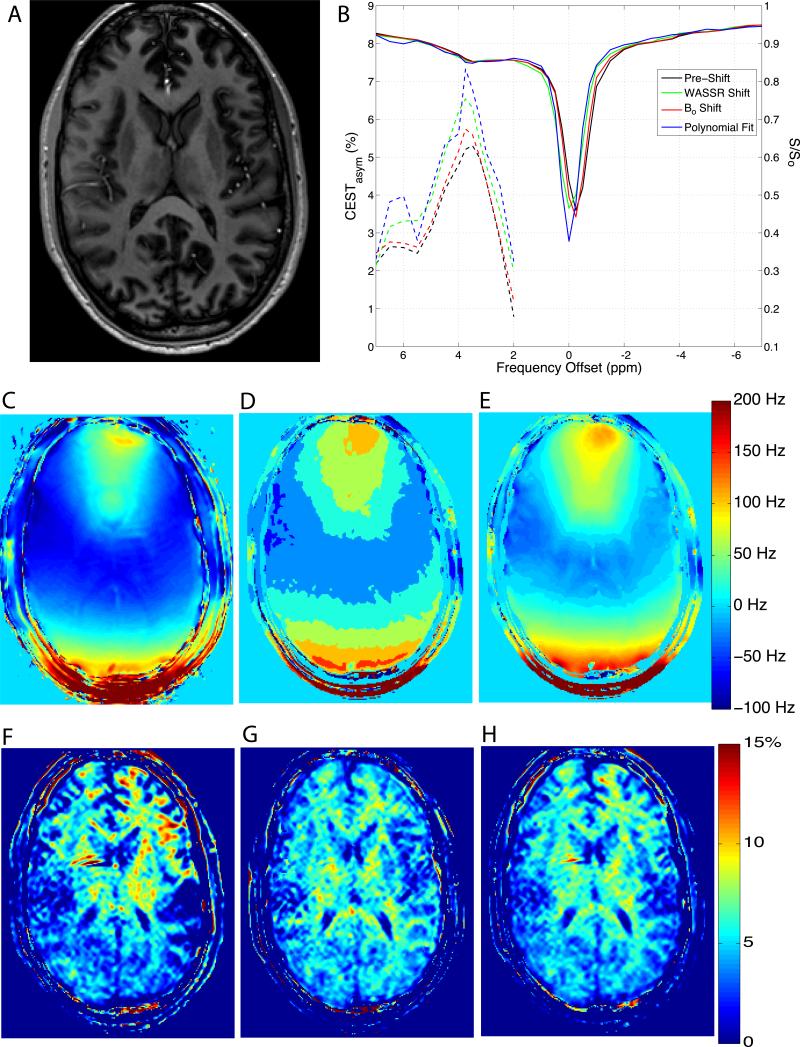
Figure 1.
Results from CEST imaging at 7T. A) CEST cpsectra from a normalized and smoothed region in the occipital white matter (solid lines, right y-axis) calculated CEST asymmetry is also shown (dashed lines, left y-axis). B) CEST spectra from a normalized and smoothed white matter region of interest (solid lines) with y-axis displayed on the right. CEST asymmetry is also shown (dashed lines) corresponding to the left y-axis. C) ΔB0 map, D) polynomial shift map, E) WASSR shift map calculated using maximum symmetry algorithm, color scale indicated on E. Asymmetry maps for the ΔB0 map (F), polynomial fit (G), and WASSR shift methods (H).

