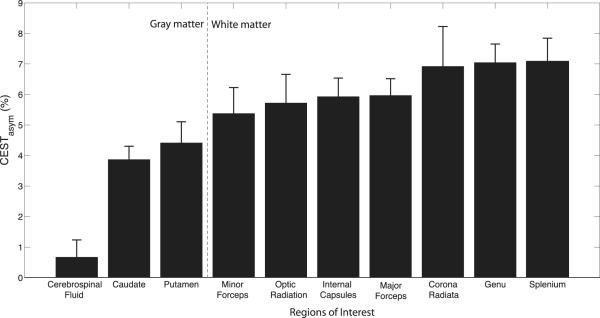
Figure 3.
Region of interest analysis of the APTasym measurements at 7T from rater 1 displaying the mean with error bars indicating the standard deviation among 10 healthy controls. White matter ROIs are separated from gray matter ROIs by the gray dashed line, which demonstrates a clear delineation of this metric between the neural tissue types.

