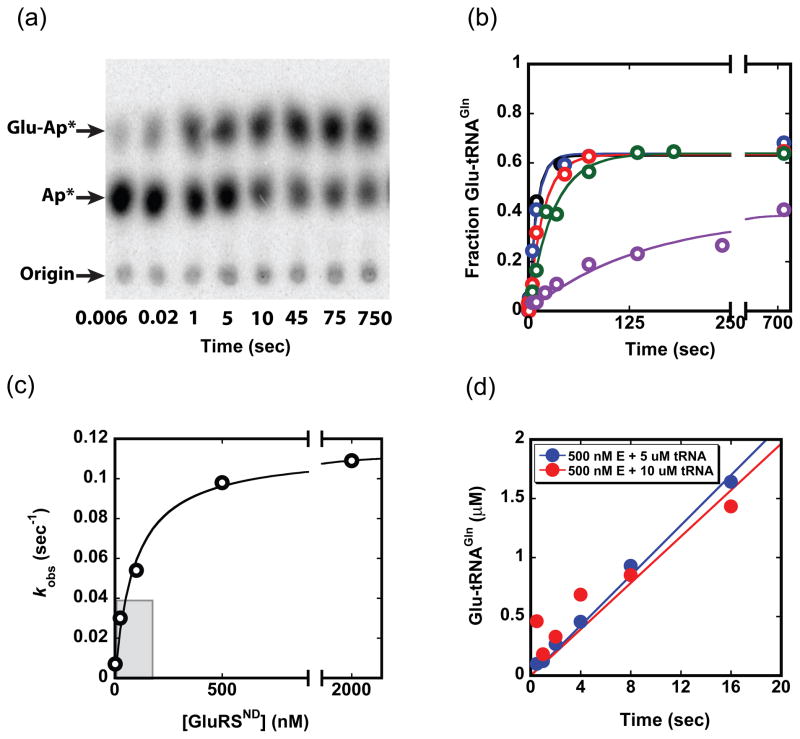
Fig. 2.
Kinetics of the tRNAGln aminoacylation reaction. (a) Thin-layer chromatography (TLC) separation of substrate and products from a single turnover reaction at 500 nM enzyme (quantitated in b). Plateau aminoacylation levels for the reaction are consistemtly in the 60–70% range. (b) Time traces of product formation at enzyme concentrations of 2 nM (purple), 25 nM (green), 100 nM (red), 500 nM (blue) and 2 μM (black). The tRNAGln concentration in each reaction is < 1 nM. Curves are fit to F = Fmax(1−e−kt), where F is the fraction Glu-tRNAGln formed, Fmax is the maximum (plateau) value of F, k is the rate constant (sec−1) and t is time (sec). (c) Plot of kobs values obtained from the data in panel (b) as a function of GluRSND concentration; from this plot we derive kmax of 0.12 ± 0.01 sec−1 and K1/2 of 43 ± 18 nM. The curve is fit to: kobs = kobs,max[GluRSND]/(K1/2 + [GluRSND]). (d) Pre-steady state kinetic timecourses at 500 nM GluRSND and either 5 μM (blue) or 10 μM tRNAGln (red).

