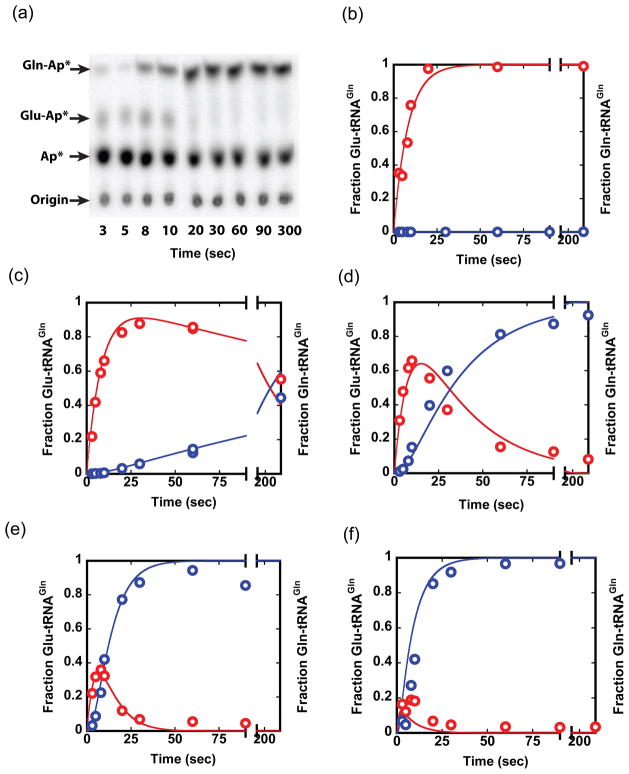
Fig. 5.
Combined GluRSND and GatDE reactions. (a) TLC plate showing transient accumulation of the Glu-tRNAGln intermediate during conversion of tRNAGln to Gln-tRNAGln in the presence of both GluRSND (600 nM) and GatDE (600 nM). Plots of normalized data and kinetic simulation traces (not fits to data) for a two-step dissociative mechanism at 600 nM GluRSND and GatDE at 0 nM (a), 10 nM (b), 100 nM (c), 600 nM (d) and 6 μM (e). tRNAGln in all the reactions < 1 nM. The panels show that, at all tested concentrations of GatDE, a distributive model fits the data well. Goodness of fit values (R2) from the nonlinear regression were computed separately using GraphPad software; for formation and reaction of Glu-tRNAGln these values range from 0.91 to 0.97. See Supplementary Figs. S3–S5 for details of kinetic simulations and evidence that a channeling model does not fit the data.

