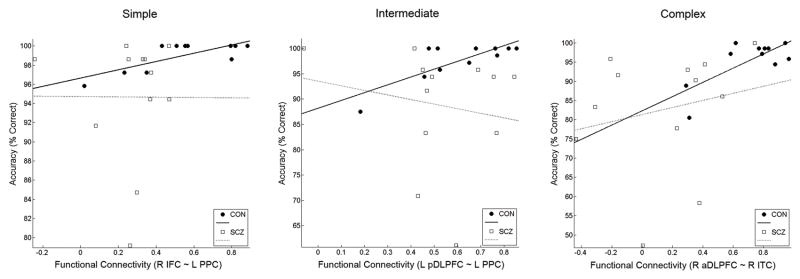
Figure 6.
Scatter plot of functional connectivity indices (temporal correlations) of the pair of right IFC and left PPC versus accuracy in simple trials (left), that of the pair of left posterior DLPFC (BA 9) and left PPC versus accuracy in intermediate trials (middle), and that of the pair of right anterior DLPFC (BA 46) and right ITC (right). Healthy control subjects had significant and tendency of positive correlations (simple: r=.77, p=.006; intermediate: r=.80, p=.003; complex: r=.74, p=.009), while schizophrenia patients did not.

