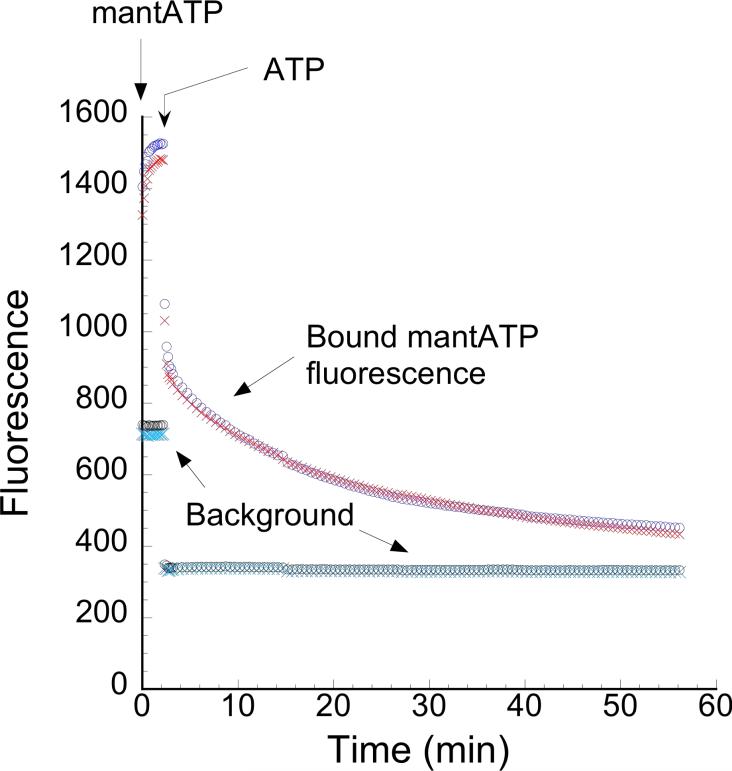
Figure 1.
The time course of a chase experiment is shown. At time = 0, the fiber is washed in a relaxing buffer containing 125 μM mantATP. Fiber fluorescence (red and blue traces) rises rapidly and reaches a new equilibrium as the mantATP binds to the nucleotide site. At time = 1 min., the fiber is chased with a wash in 4 mM ATP. Fiber fluorescence then decreases as ATP replaces mantATP at the nucleotide site. The background fluorescence is shown in cyan and black. The microscope system allows simultaneous monitoring of the fluorescence intensity of mant-nucleotides in four regions in the field. Two regions are placed on the fiber (red and blue traces). The other two regions (black and cyan traces) are placed to record the background. The background signal is averaged and subtracted from the individual observed fiber fluorescences for fluorescence signal analysis.

