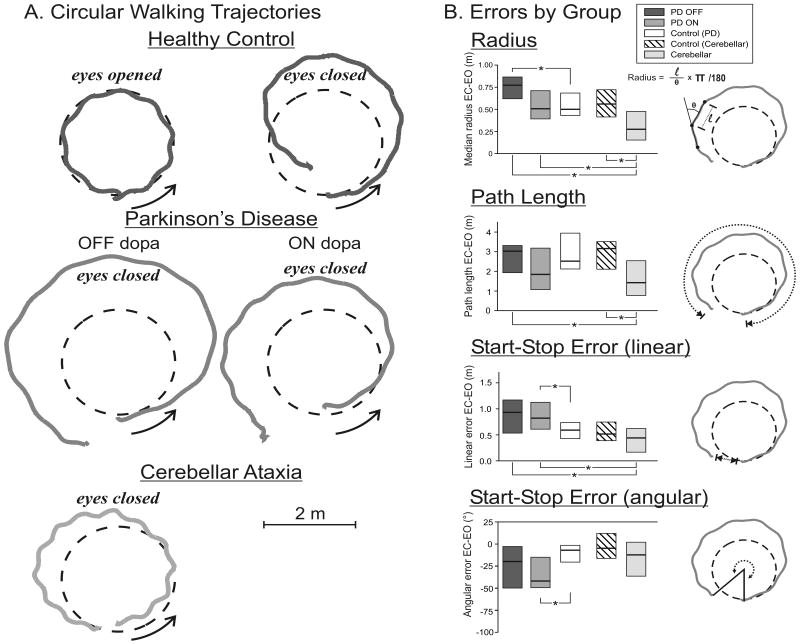
Figure 1.
A. Representative walking trajectories from one healthy control (top panels), one subject with Parkinson's Disease (PD; middle panel) and a subject with cerebellar ataxia (bottom panel). The black dashed circles represent the outlined circle on the floor and gray traces, the subjects' trajectories. Arrows indicate the direction in which subjects walked (counterclockwise direction presented). The eyes open condition in the healthy control subject is representative of the same condition in all subject groups. B. Group medians for all trajectory metrics are presented has horizontal lines and boxes represent the interquartile range of the data (median+IQR). Each metric corresponds to the dotted lines illustrated in the icons on the right side of each bar graph. * denotes p <0.05

