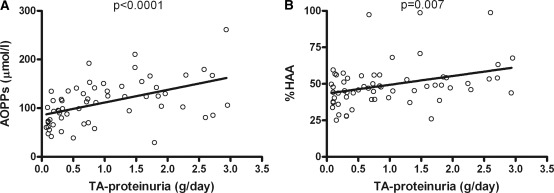
Figure 6.
Correlation between time-average proteinuria and AOPPs or galactose-deficient IgA1. Correlation between time-average proteinuria (TA-proteinuria) over the follow-up interval after sampling and serum levels of AOPPs (A) and %HAA (B). AOPPs, advanced oxidation protein products; %HAA, % Helix aspersa agglutinin; TA, time-average.

